| Issue |
Parasite
Volume 32, 2025
|
|
|---|---|---|
| Article Number | 42 | |
| Number of page(s) | 18 | |
| DOI | https://doi.org/10.1051/parasite/2025035 | |
| Published online | 04 July 2025 | |
Supplementary material
Supplementary Note 1: Functional characterization of differentially expressed gene families. Access here
Supplementary Table 1: Average binding free energies calculated from molecular dynamics (MD) simulations for moxidectin (MOX) and the chloride channel of Leishmania tropica. Access here
Supplementary Table 2: Top 10 upregulated and downregulated genes in L. tropica promastigotes following moxidectin (MOX) exposure, with corresponding log2 fold change values and statistical significance. Access here
Supplementary Table 3: Top 10 upregulated and downregulated genes in L. tropica intracellular amastigotes following moxidectin (MOX) exposure, with corresponding log2 fold change values and statistical significance. Access here
Supplementary Table 4: List of differentially expressed genes within the seven assembled gene sets, including ABC transporters, HSP70, cytochrome c oxidase, NADH-cytochrome b5 reductase, aquaporins, major facilitator superfamily (MFS), and chloride channels. Access here
|
Supplementary Figure 1:
Differential gene expression profiles in L. tropica promastigotes and amastigotes following moxidectin (MOX) exposure. |
 |
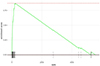
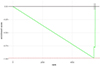
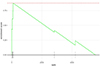
Supplementary Figure 2:
Gene set enrichment analysis (GSEA) plots for ABC transporters in intracellular amastigotes of L. tropica. |
 |
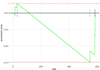
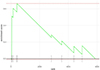
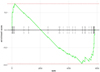
Supplementary Figure 3:
Gene set enrichment analysis (GSEA) plots for ABC transporters in promastigotes of L. tropica. |
 |
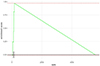
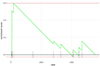
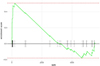
Supplementary Figure 4:
Gene set enrichment analysis (GSEA) plots for aquaporins in intracellular amastigotes of L. tropica. |
 |
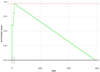
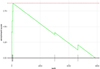
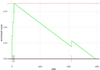
Supplementary Figure 5:
Gene set enrichment analysis (GSEA) plots for aquaporins in promastigotes of L. tropica. |
 |
Supplementary Figure 6:
Gene set enrichment analysis (GSEA) plots for chloride channels in intracellular amastigotes of L. tropica. |
 |
Supplementary Figure 7:
Gene set enrichment analysis (GSEA) plots for chloride channels in promastigotes of L. tropica. |
 |
Supplementary Figure 8:
Gene set enrichment analysis (GSEA) plots for cytochrome c oxidase in intracellular amastigotes of L. tropica. |
 |
Supplementary Figure 9:
Gene set enrichment analysis (GSEA) plots for cytochrome c oxidase in promastigotes of L. tropica. |
 |
Supplementary Figure 10:
Gene set enrichment analysis (GSEA) plots for HSP70 in intracellular amastigotes of L. tropica. |
 |
Supplementary Figure 11:
Gene set enrichment analysis (GSEA) plots for HSP70 in promastigotes of L. tropica. |
 |
Supplementary Figure 12:
Gene set enrichment analysis (GSEA) plots for major facilitator superfamily (MFS) proteins in intracellular amastigotes of L. tropica. |
 |
Supplementary Figure 13:
Gene set enrichment analysis (GSEA) plots for major facilitator superfamily (MFS) proteins in promastigotes of L. tropica. |
 |
Supplementary Figure 14:
Gene set enrichment analysis (GSEA) plots for NADH-cytochrome b5 reductase in intracellular amastigotes of L. tropica. |
 |
Supplementary Figure 15:
Gene set enrichment analysis (GSEA) plots for NADH-cytochrome b5 reductase in promastigotes of L. tropica. |
© L. Al Samra et al., published by EDP Sciences, 2025
Current usage metrics show cumulative count of Article Views (full-text article views including HTML views, PDF and ePub downloads, according to the available data) and Abstracts Views on Vision4Press platform.
Data correspond to usage on the plateform after 2015. The current usage metrics is available 48-96 hours after online publication and is updated daily on week days.
Initial download of the metrics may take a while.