Figure 4
Download original image
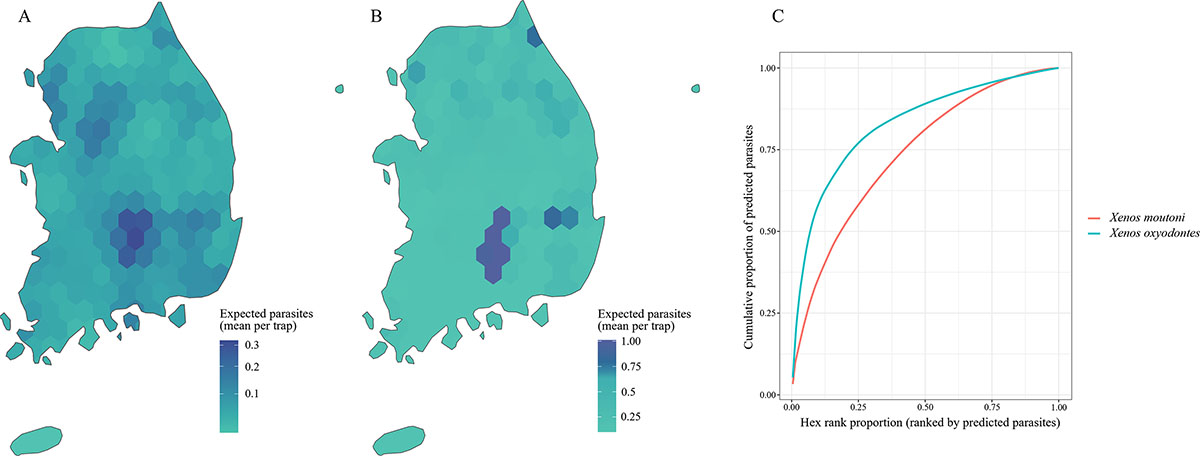
Spatial distributions of the GLM-based, host-capture–adjusted expected stylopized-host counts (![]() ) for two Xenos species, (A) X. moutoni and (B) X. oxyodontes, in South Korea. The expected numbers of stylopized hosts per trap were estimated using a negative binomial GLM and then binned into a hexagonal grid. (C) Rank–cumulative curves for each Xenos species showing the cumulative proportion of the total expected stylopized-host count (
) for two Xenos species, (A) X. moutoni and (B) X. oxyodontes, in South Korea. The expected numbers of stylopized hosts per trap were estimated using a negative binomial GLM and then binned into a hexagonal grid. (C) Rank–cumulative curves for each Xenos species showing the cumulative proportion of the total expected stylopized-host count (![]() ) across hexagons ranked in descending order of the expected total stylopized-host count. The spatial distribution patterns of the two species were significantly different based on permutation tests comparing their AUC values (p < 0.001).
) across hexagons ranked in descending order of the expected total stylopized-host count. The spatial distribution patterns of the two species were significantly different based on permutation tests comparing their AUC values (p < 0.001).
Current usage metrics show cumulative count of Article Views (full-text article views including HTML views, PDF and ePub downloads, according to the available data) and Abstracts Views on Vision4Press platform.
Data correspond to usage on the plateform after 2015. The current usage metrics is available 48-96 hours after online publication and is updated daily on week days.
Initial download of the metrics may take a while.