Figure 1
Download original image
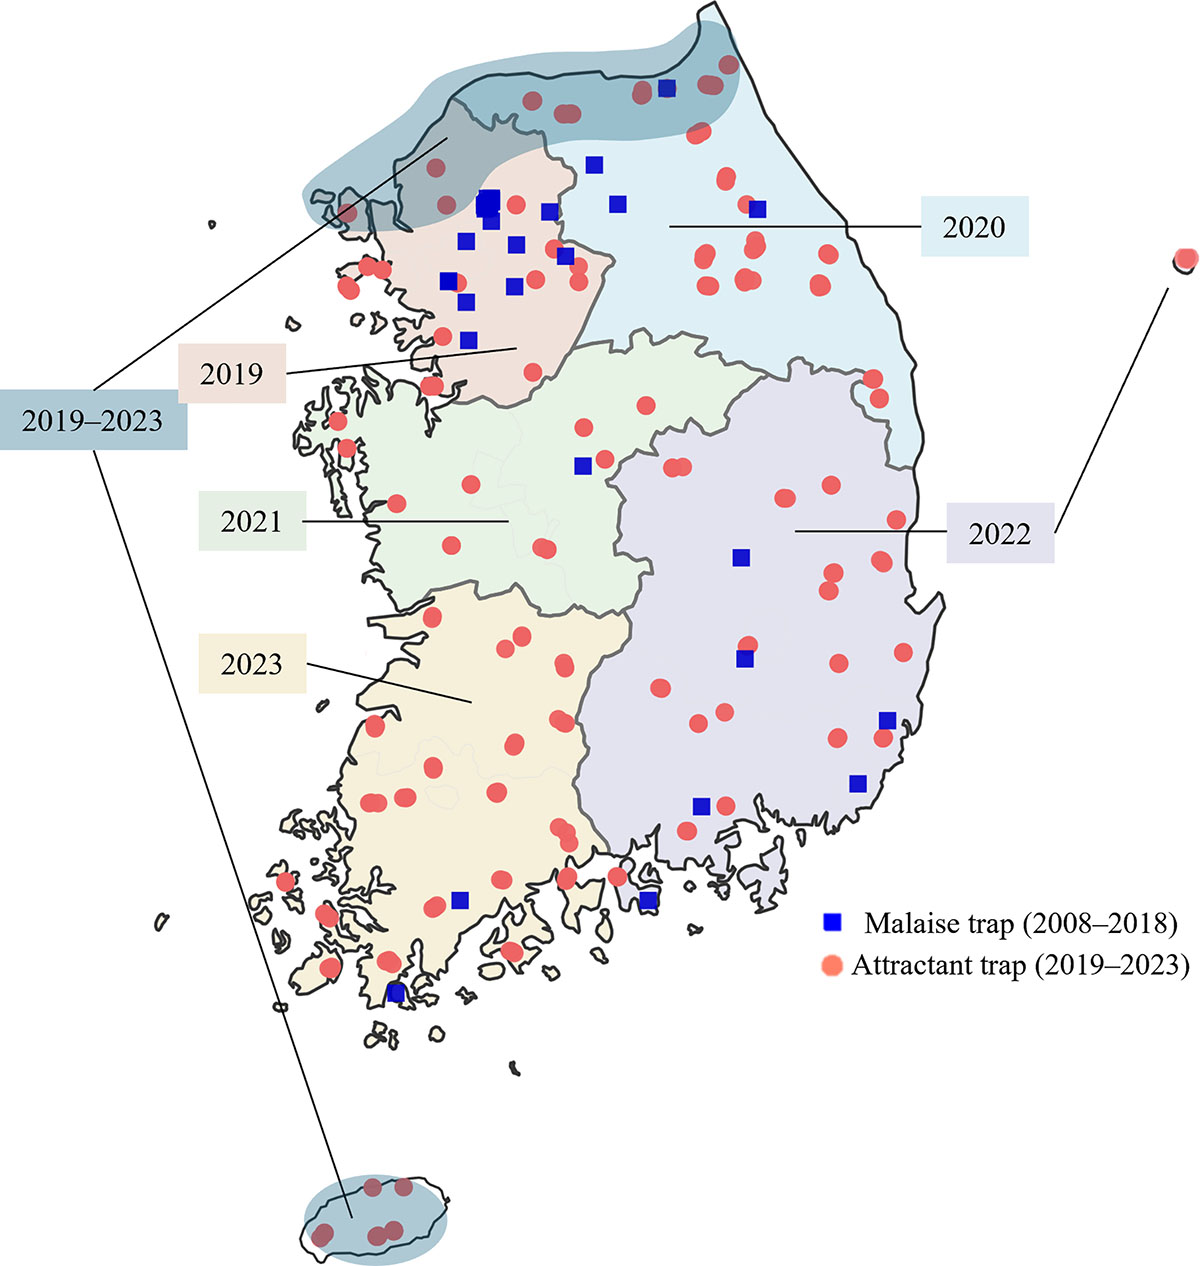
Spatial distribution of 677 trapping sites in South Korea (2008–2023). Blue squares represent Malaise trap sites, sampled from 2008 to 2018, and red circles indicate sugar-attractant trap sites, sampled from 2019 to 2023. Shaded areas approximate the year-specific sugar attractant trap survey coverage over the 2019–2023 period, with the years specified on the map.
Current usage metrics show cumulative count of Article Views (full-text article views including HTML views, PDF and ePub downloads, according to the available data) and Abstracts Views on Vision4Press platform.
Data correspond to usage on the plateform after 2015. The current usage metrics is available 48-96 hours after online publication and is updated daily on week days.
Initial download of the metrics may take a while.