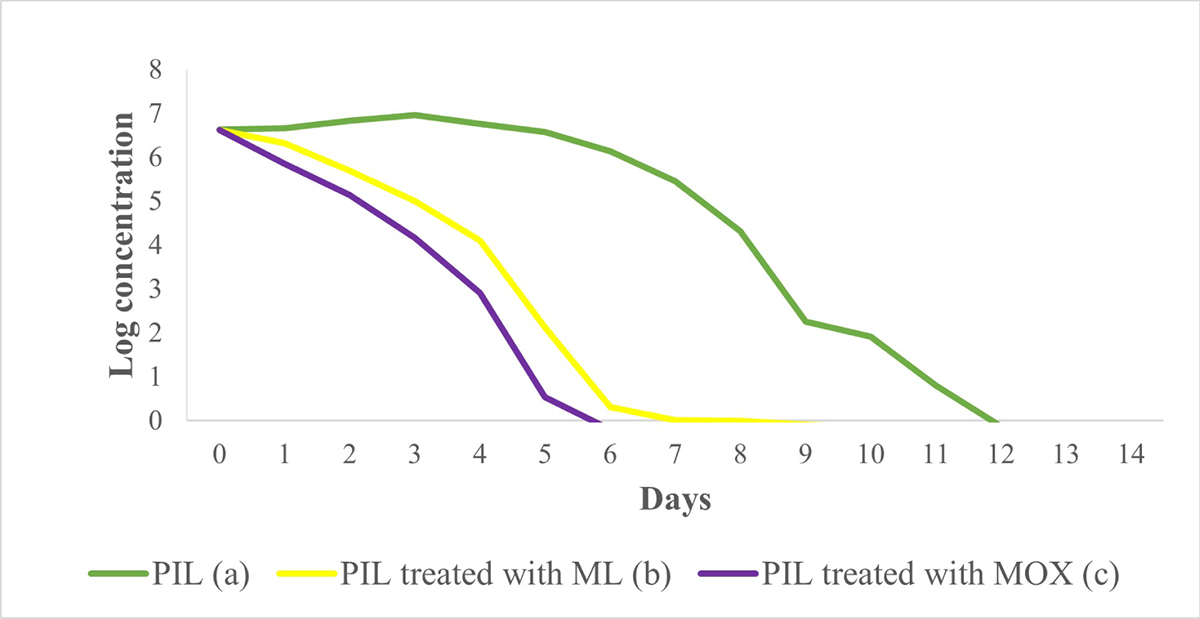
Figure 4
Download original image
In vivo time-dependent reduction in Leishmania tropica load following treatment with miltefosine (ML) and moxidectin (MOX) using Galleria mellonella as the infection model. Statistical analysis of the area under the curve (AUC) revealed significant differences between all groups (p < 0.05; one-way ANOVA with Tukey’s HSD test). Groups with different letters are significantly different: PIL (a) 57.37 (SE = 0.19); PIL treated with ML (b) 25.60 (SE = 0.30); PIL treated with MOX (c) 19.32 (SE = 0.24).
Current usage metrics show cumulative count of Article Views (full-text article views including HTML views, PDF and ePub downloads, according to the available data) and Abstracts Views on Vision4Press platform.
Data correspond to usage on the plateform after 2015. The current usage metrics is available 48-96 hours after online publication and is updated daily on week days.
Initial download of the metrics may take a while.