Figure 1

Download original image
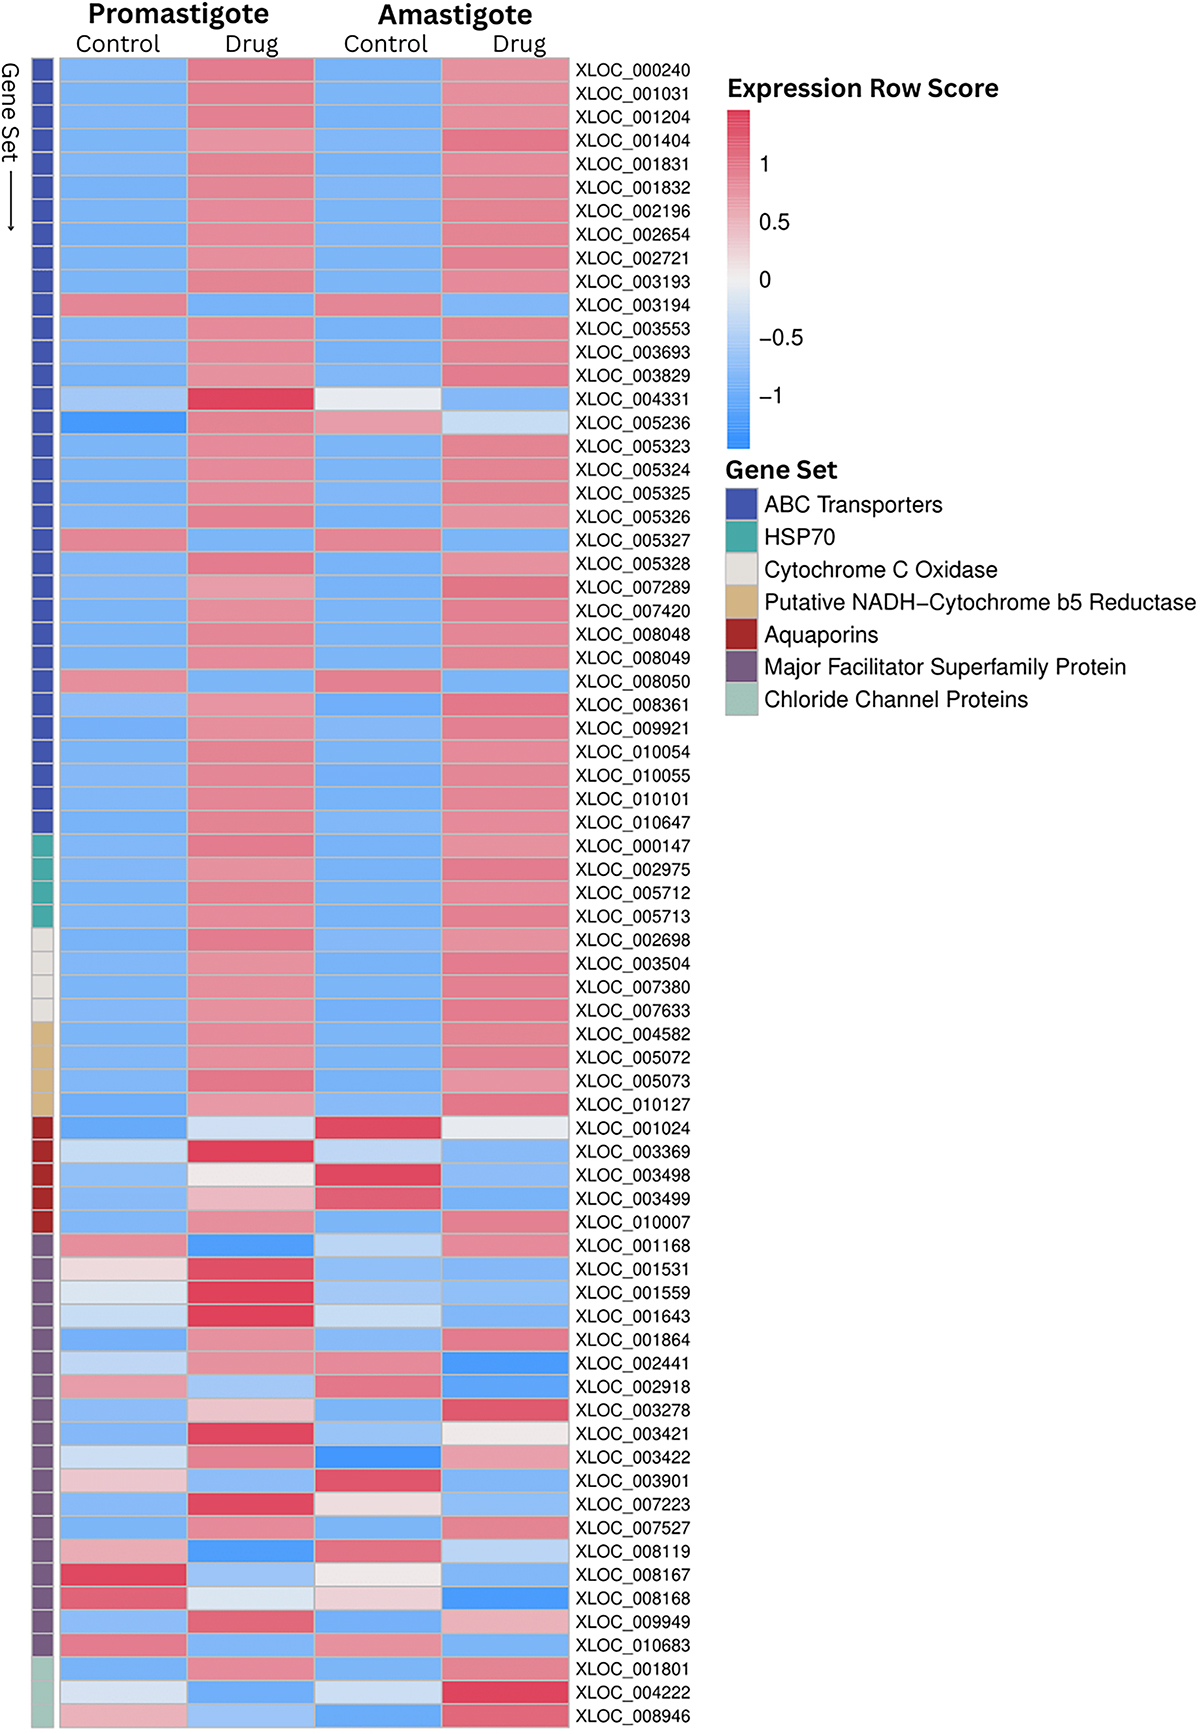
Heatmap of differentially expressed genes in Leishmania tropica promastigotes and amastigotes based on RNA-Seq expression values (Control vs. moxidectin-treated). The heatmap displays the normalized gene expression profiles derived from RNA-Seq differential expression analysis, comparing control and MOX-treated samples across promastigotes and amastigotes. Expression values are row Z-score normalized to highlight relative changes across samples with condition-specific patterns reflecting MOX-induced transcriptomic shifts.
Current usage metrics show cumulative count of Article Views (full-text article views including HTML views, PDF and ePub downloads, according to the available data) and Abstracts Views on Vision4Press platform.
Data correspond to usage on the plateform after 2015. The current usage metrics is available 48-96 hours after online publication and is updated daily on week days.
Initial download of the metrics may take a while.


