| Issue |
Parasite
Volume 31, 2024
|
|
|---|---|---|
| Article Number | 53 | |
| Number of page(s) | 12 | |
| DOI | https://doi.org/10.1051/parasite/2024053 | |
| Published online | 06 September 2024 | |
Supplementary material
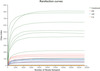 |
Figure S1: Rarefaction curve analysis conducted on normalized ASVs. |
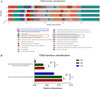 |
Figure S2: Functional prediction of COG-related gene abundance in the microbiota of the uninfected, EH, AH, and CA groups. (A) Prediction of the functional potential of microbial communities at different stages of biliary disease in the infected and uninfected groups using PICRUSt2. (B) COG functional prediction analysis of gene functionality abundance related to “Amino acid transport and metabolism” and “Secondary metabolite biosynthesis, transport and catabolism” in the EH, AH, and CA groups. |
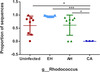 |
Figure S3: Kruskal–Wallis test analysis of the relative abundance of Rhodococcus in the bile of the uninfected, EH, AH, and CA groups. |
© F. Li et al., published by EDP Sciences, 2024
Current usage metrics show cumulative count of Article Views (full-text article views including HTML views, PDF and ePub downloads, according to the available data) and Abstracts Views on Vision4Press platform.
Data correspond to usage on the plateform after 2015. The current usage metrics is available 48-96 hours after online publication and is updated daily on week days.
Initial download of the metrics may take a while.