| Issue |
Parasite
Volume 31, 2024
|
|
|---|---|---|
| Article Number | 9 | |
| Number of page(s) | 13 | |
| DOI | https://doi.org/10.1051/parasite/2024007 | |
| Published online | 09 February 2024 | |
Supplementary material
Table S1: Normal distribution tests for normal rates and different transitions of articles hosted by humans. Access here
Table S2: Main characteristics of the included studies in humans. Access here
Table S3: Egger for publication bias. Access here
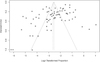 |
Figure S1:
Funnel plot with pseudo 95% confidence interval for publication bias test. |
 |
Figure S2:
Egger’s test for publication bias. |
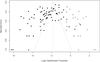 |
Figure S3:
Shear complement graph and pseudo 95% confidence interval for publication bias test. |
 |
Figure S4:
Figure S4: Sensitivity analysis of human infection with E. bieneusi. |
© Y. Wang et al., published by EDP Sciences, 2024
Current usage metrics show cumulative count of Article Views (full-text article views including HTML views, PDF and ePub downloads, according to the available data) and Abstracts Views on Vision4Press platform.
Data correspond to usage on the plateform after 2015. The current usage metrics is available 48-96 hours after online publication and is updated daily on week days.
Initial download of the metrics may take a while.