Open Access
Figure 7
Download original image
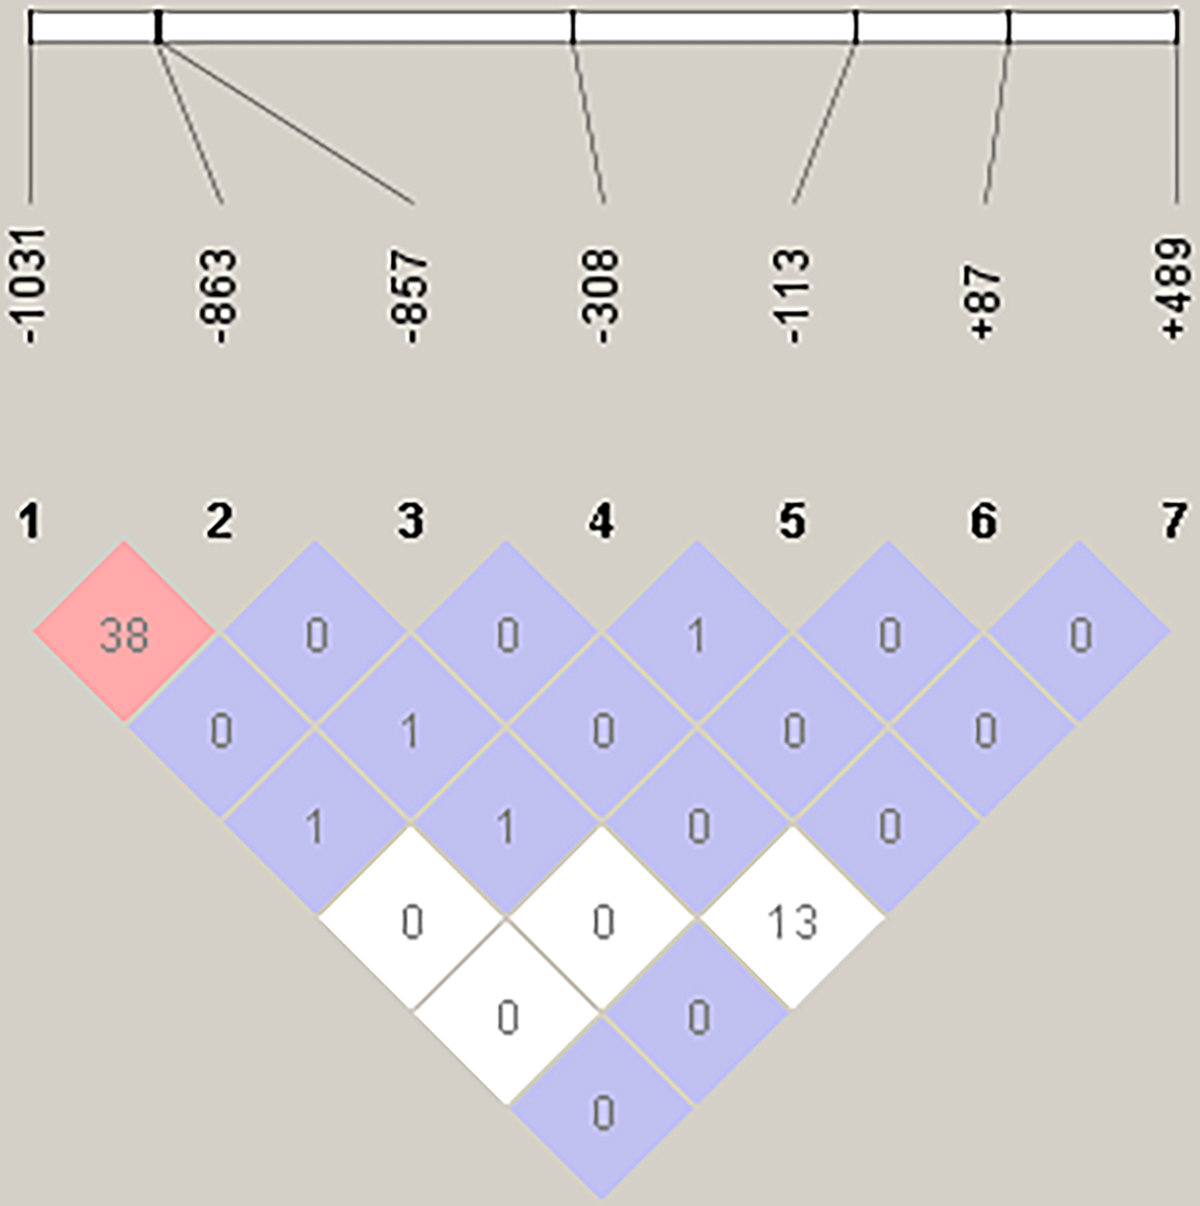
Tests for pair-wise linkage disequilibrium tests between SNPs in Sh infected groups in relation to morbidity. The numbers in the boxes are the R2 (%) values. The stronger the association between two SNPs, the higher the R2 value.
Current usage metrics show cumulative count of Article Views (full-text article views including HTML views, PDF and ePub downloads, according to the available data) and Abstracts Views on Vision4Press platform.
Data correspond to usage on the plateform after 2015. The current usage metrics is available 48-96 hours after online publication and is updated daily on week days.
Initial download of the metrics may take a while.