Figure 4
Download original image
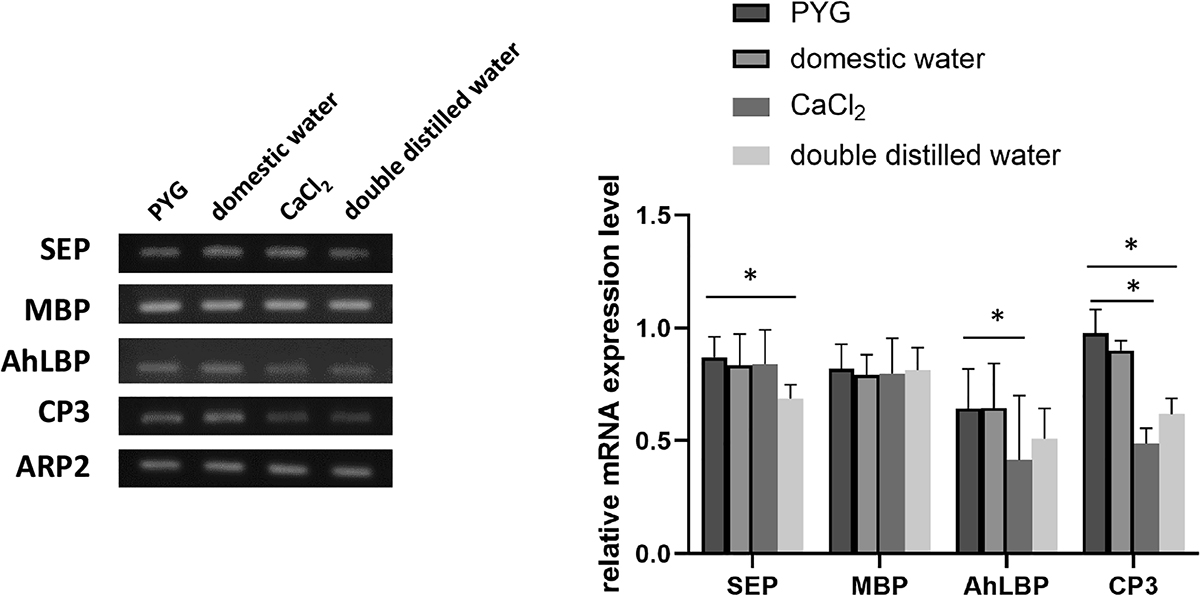
Expression of virulence factors in Acanthamoeba pretreated with different water conditions. The relative mRNA expression levels of SEP, MBP, AhLBP, and CP3 in Acanthamoeba pretreated with PYG medium, PAS, domestic tap water, CaCl2, or DDW for one hour were quantified using ImageJ software. The expression levels of the ARP2 gene served as an internal control. Bar graphs represent the mean ± SD (p ≤ 0.05).
Current usage metrics show cumulative count of Article Views (full-text article views including HTML views, PDF and ePub downloads, according to the available data) and Abstracts Views on Vision4Press platform.
Data correspond to usage on the plateform after 2015. The current usage metrics is available 48-96 hours after online publication and is updated daily on week days.
Initial download of the metrics may take a while.