Figure 3
Download original image
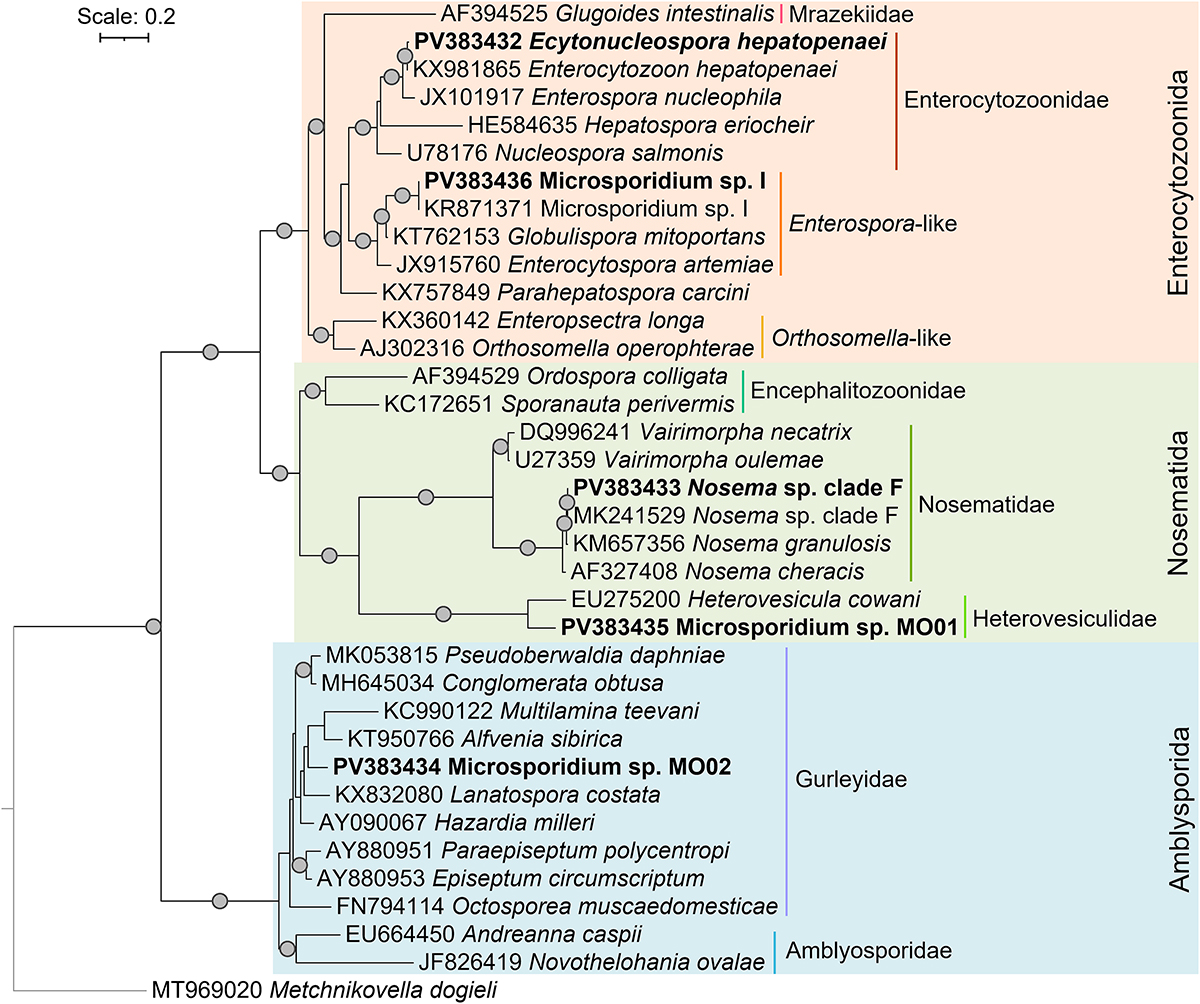
Maximum likelihood phylogenetic tree of microsporidians identified in this study. Grey dots represent bootstrap support values above 90%. Sequences obtained in this study are indicated in bold. The substitution model used was TIM3 + F + I + R4, and Metchnikovella dogieli represents the outgroup. The names and circumscriptions of microsporidian orders followed [5].
Current usage metrics show cumulative count of Article Views (full-text article views including HTML views, PDF and ePub downloads, according to the available data) and Abstracts Views on Vision4Press platform.
Data correspond to usage on the plateform after 2015. The current usage metrics is available 48-96 hours after online publication and is updated daily on week days.
Initial download of the metrics may take a while.