Open Access
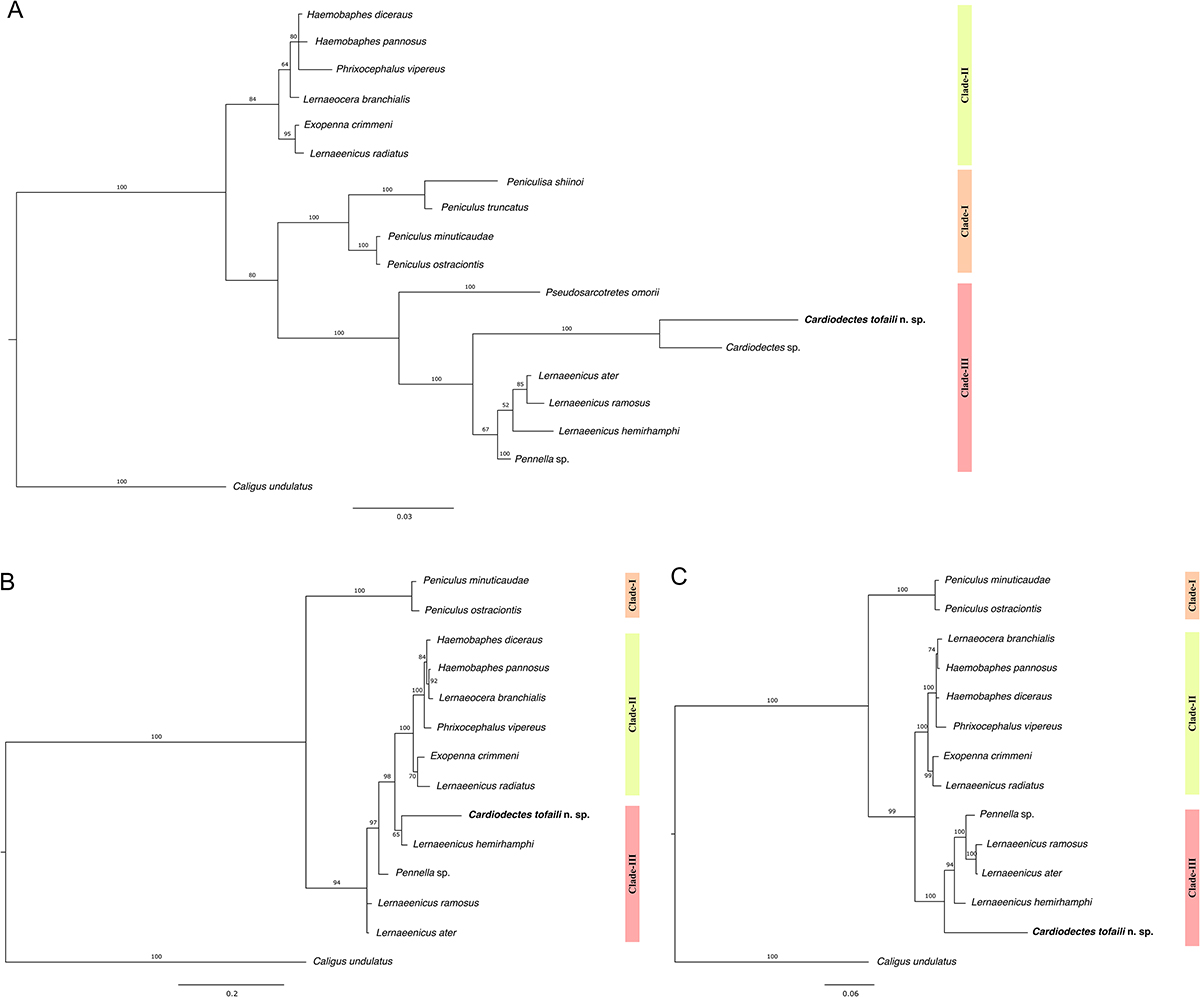
Figure 6
Download original image
Phylogenetic trees of pennellids based on (A) 18S rDNA, (B) 28S rDNA, and (C) concatenated 18S and 28S rDNA sequences, using Caligus undulatus as the outgroup taxa. Node numbers indicate bootstrap values for analyses of posterior probabilities (%) for Bayesian analysis. Scale bars represent nucleotide changes per site.
Current usage metrics show cumulative count of Article Views (full-text article views including HTML views, PDF and ePub downloads, according to the available data) and Abstracts Views on Vision4Press platform.
Data correspond to usage on the plateform after 2015. The current usage metrics is available 48-96 hours after online publication and is updated daily on week days.
Initial download of the metrics may take a while.