Figure 4
Download original image
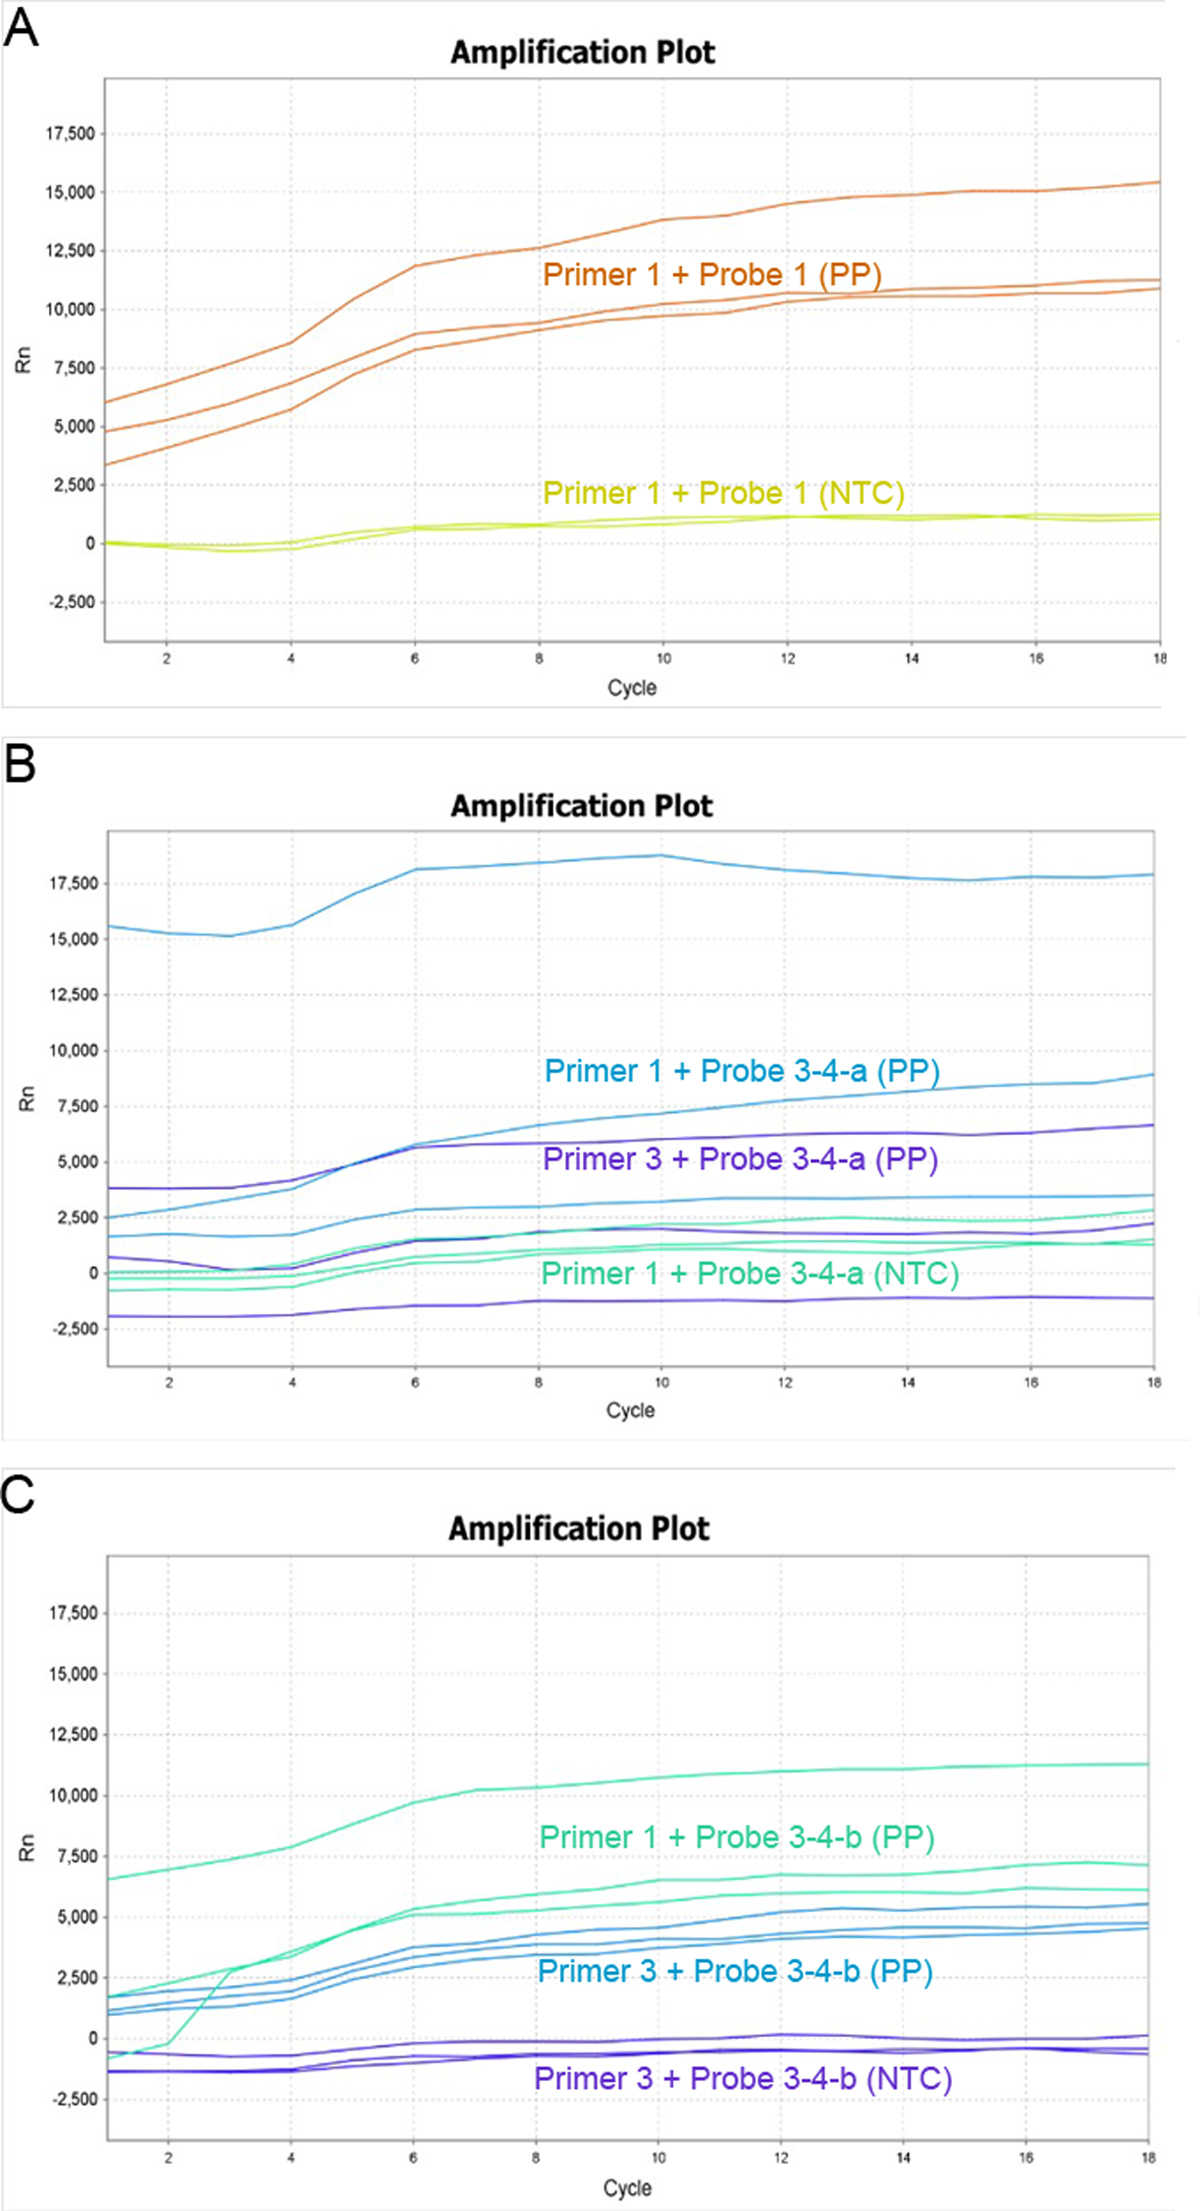
Fluorescence amplification curve of primer and probe combination. (A) The fluorescence amplification curve of Primer 1 + Probe 1 is very high in the positive plasmid control of T. gondii for three repeats; (B) The fluorescence curve of Primer 1 + Probe 3–4-a and Primer 3 + Probe 3–4-a indicates no significant amplification, and the consistency is poor for three repeats; (C) The fluorescence curve of Primer 1 + Probe 3–4-b and Primer 3 + Probe 3–4-b also shows no significant amplification, and the amplification consistency of Primer 1 + Probe 3–4-b is poor for the three repeats. PP: positive plasmid control; NTC: negative control.
Current usage metrics show cumulative count of Article Views (full-text article views including HTML views, PDF and ePub downloads, according to the available data) and Abstracts Views on Vision4Press platform.
Data correspond to usage on the plateform after 2015. The current usage metrics is available 48-96 hours after online publication and is updated daily on week days.
Initial download of the metrics may take a while.