Open Access
Figure 3
Download original image
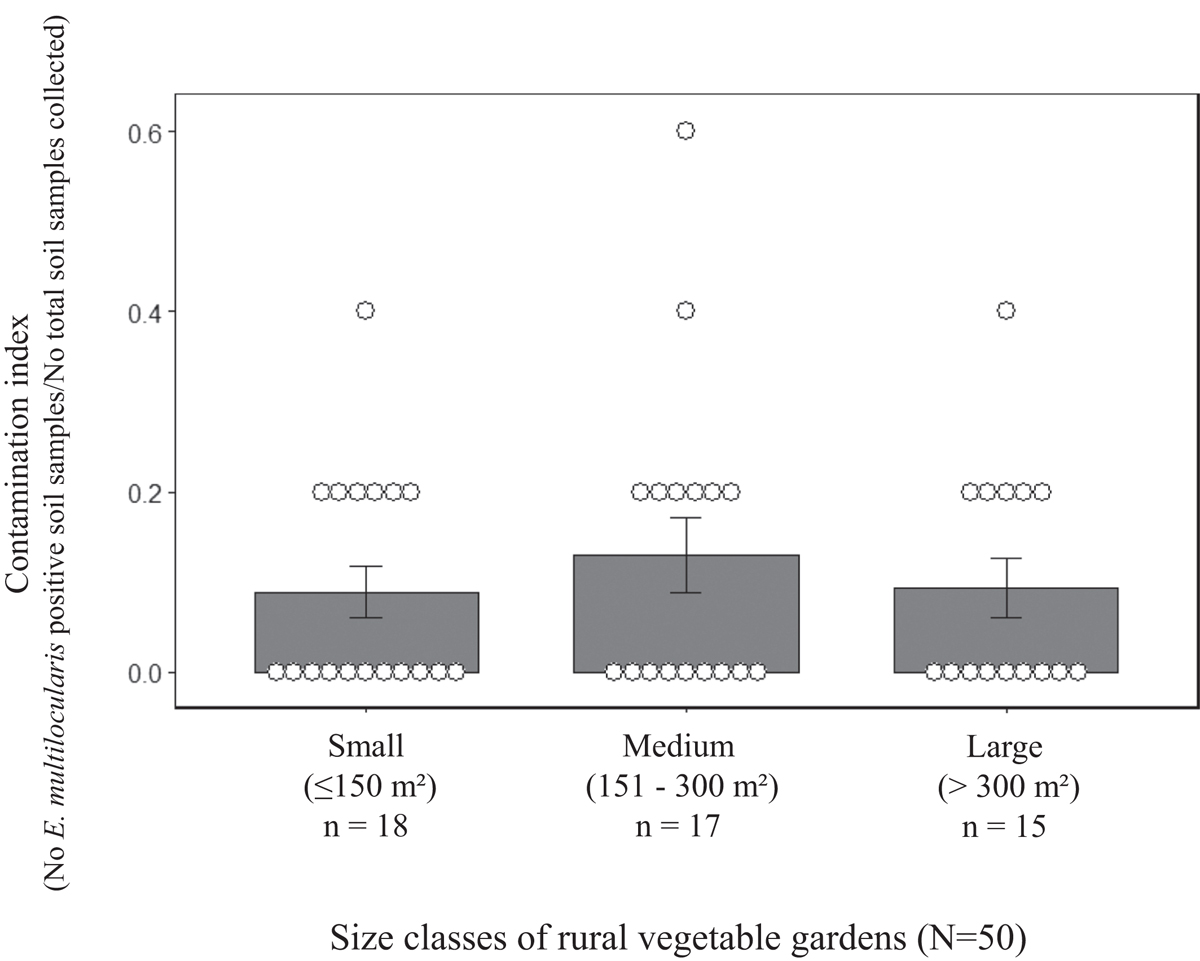
Index of soil contamination by Echinococcus multilocularis in relation to the size of rural vegetable gardens sampled in north-eastern France. Bars represent the mean contamination index (± Standard Error); white crenelated dots, the contamination index per vegetable garden.
Current usage metrics show cumulative count of Article Views (full-text article views including HTML views, PDF and ePub downloads, according to the available data) and Abstracts Views on Vision4Press platform.
Data correspond to usage on the plateform after 2015. The current usage metrics is available 48-96 hours after online publication and is updated daily on week days.
Initial download of the metrics may take a while.