Figure 7
Download original image
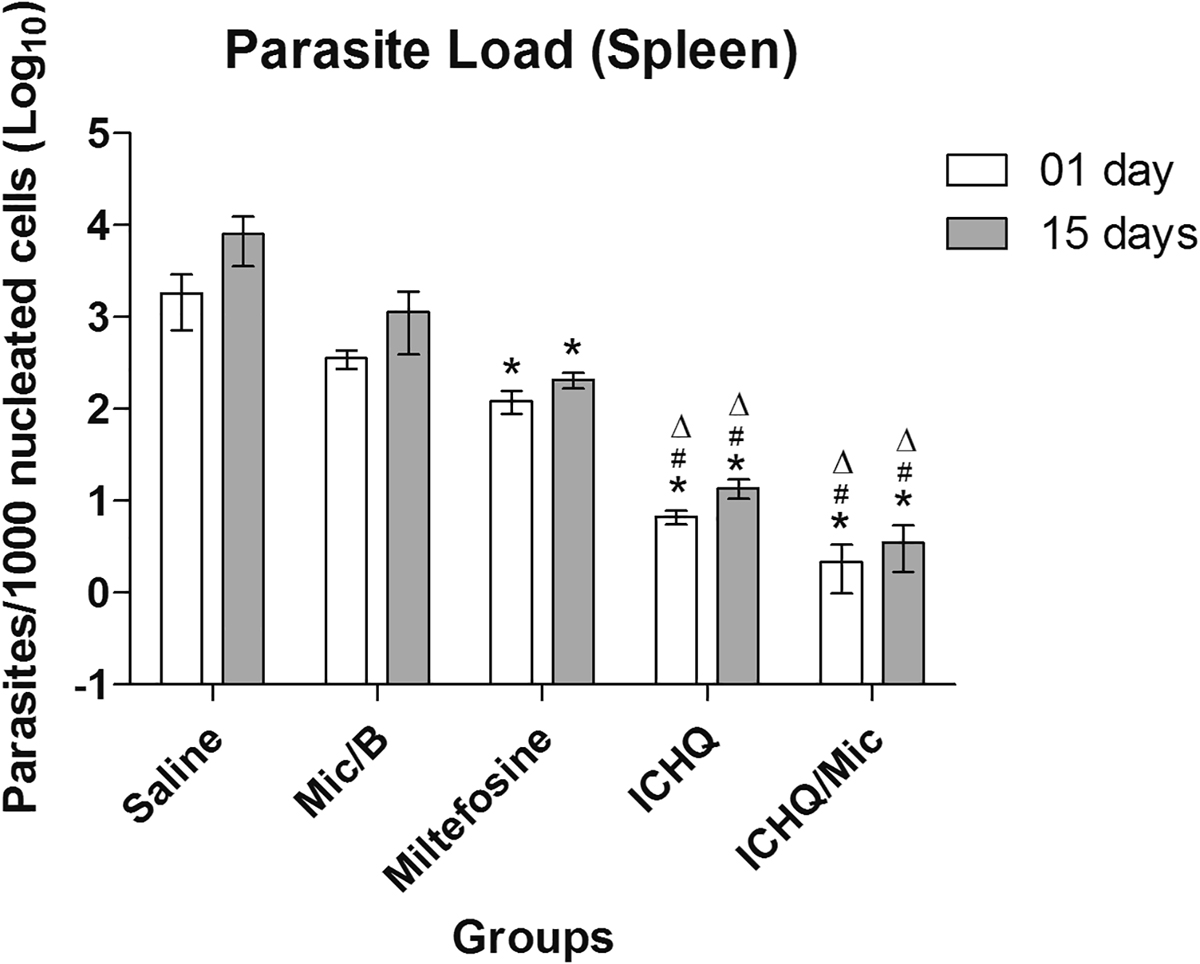
Splenic parasitism evaluated by RT-PCR. Splenic parasitism was also evaluated by RT-PCR, one and 15 days after treatment. Results were converted into number of parasites (in log) per nucleated cell (multiplied by one thousand to facilitate visualization). Bars indicate the mean ± standard deviation of the groups. (*), (#) and (Δ) indicate statistically significant differences in comparison to the saline, Mic/B and miltefosine groups, respectively (p < 0.05).
Current usage metrics show cumulative count of Article Views (full-text article views including HTML views, PDF and ePub downloads, according to the available data) and Abstracts Views on Vision4Press platform.
Data correspond to usage on the plateform after 2015. The current usage metrics is available 48-96 hours after online publication and is updated daily on week days.
Initial download of the metrics may take a while.