Figure 3
Download original image
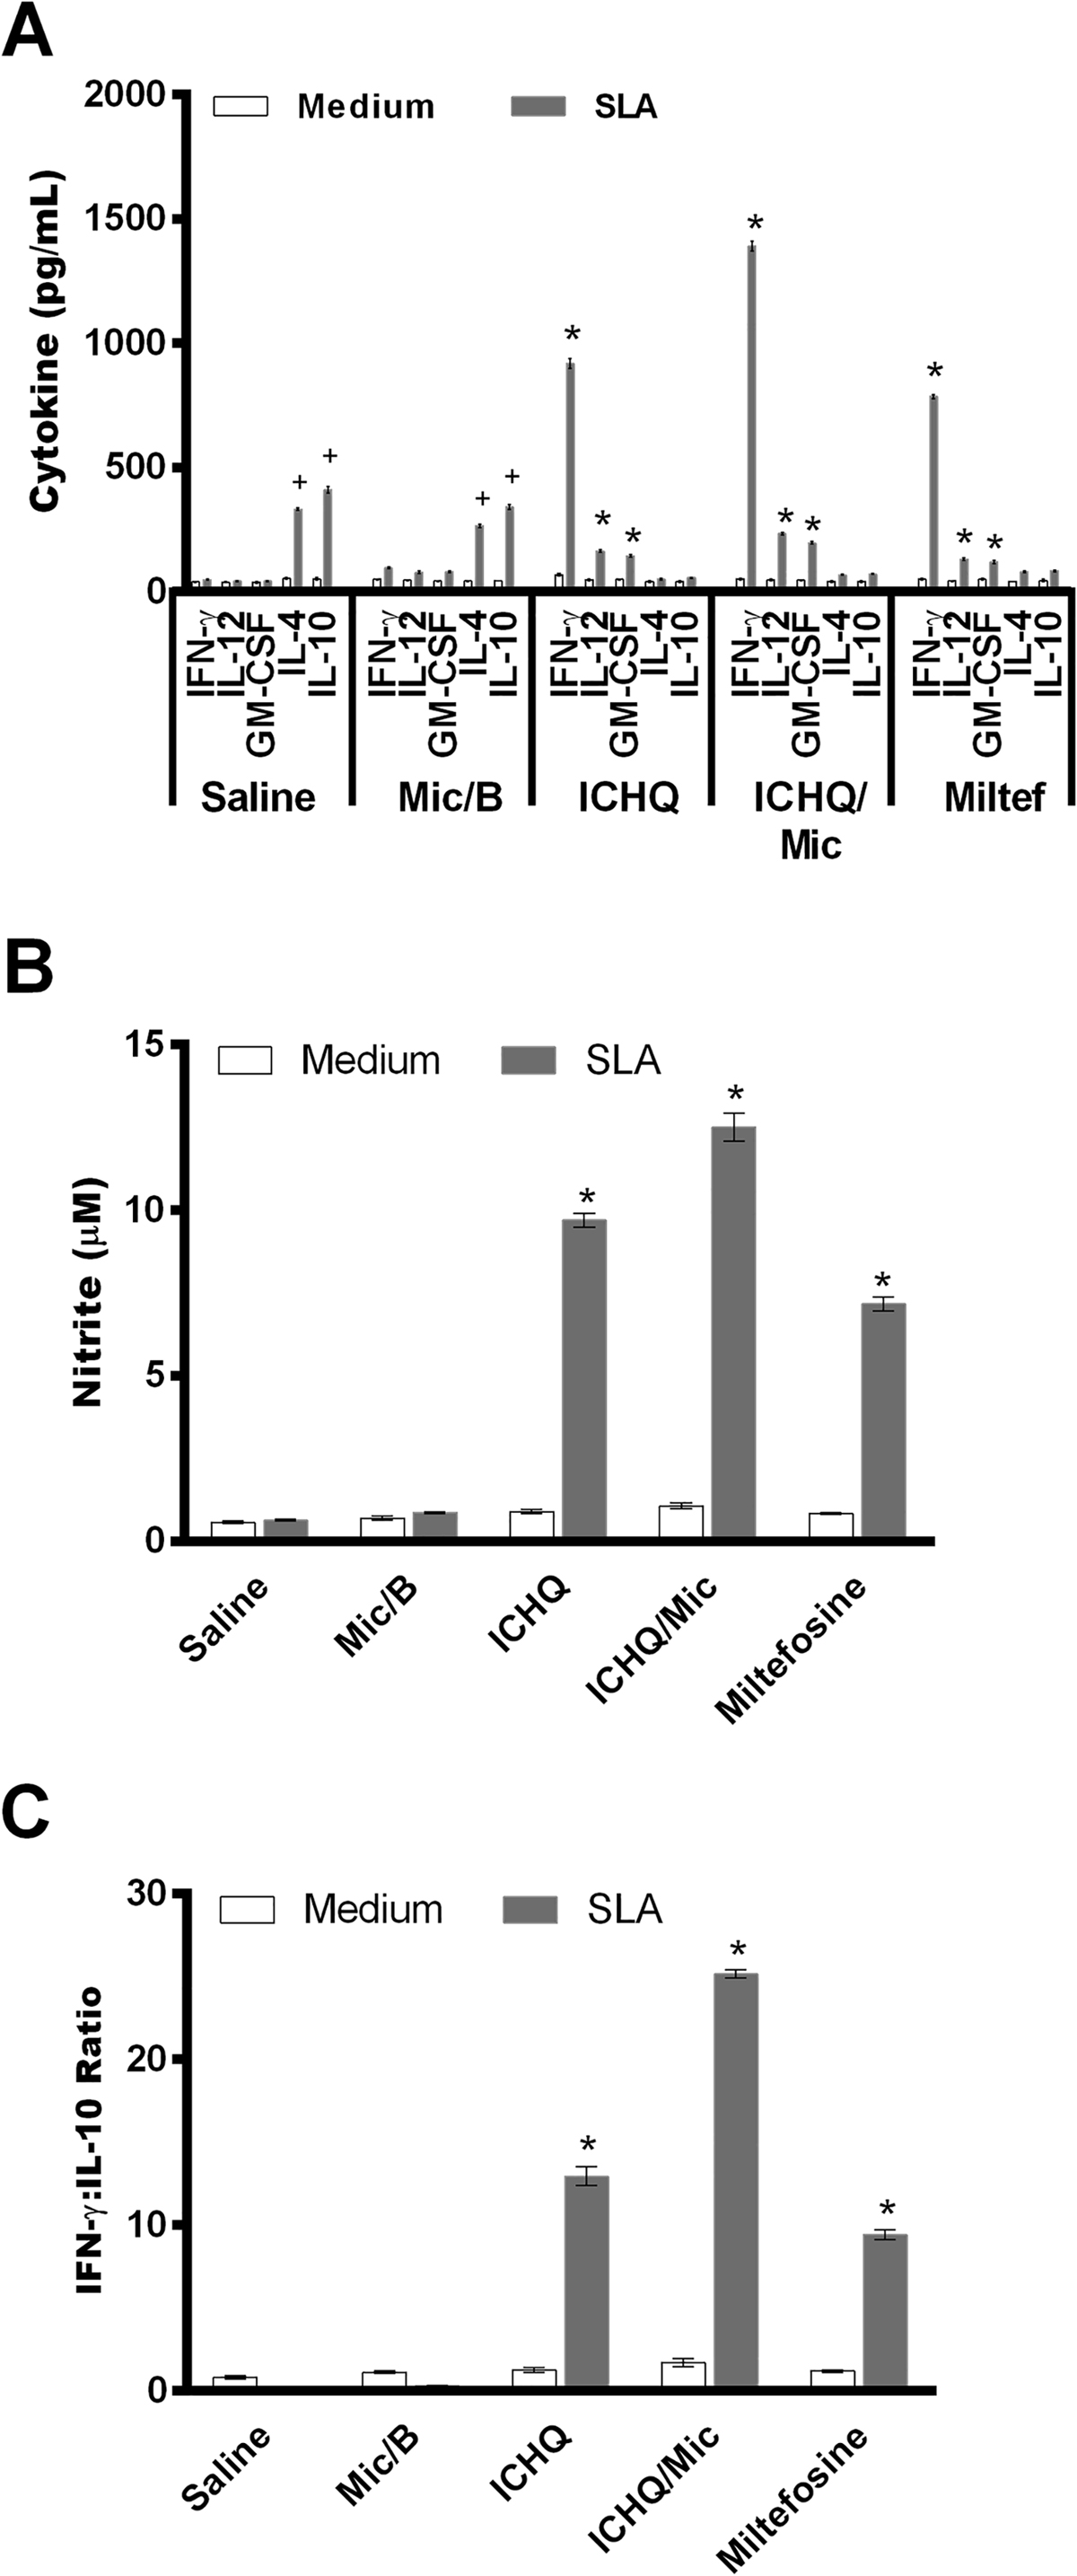
Cellular profile generated in the treated and infected animals, 15 days after treatment. Fifteen days after treatment, cellular response was also evaluated in the treated and infected animals. Spleen cells (5 × 10⁶ per mL) were non-stimulated (medium) or stimulated with Leishmania infantum SLA (50 μg/mL) for 48 h at 37 °C in 5% CO2. IFN-γ, IL-4, IL-10, IL-12p70 and GM-CSF levels were measured in the cell supernatant by a capture ELISA (A). Nitrite production was also evaluated in the cell supernatant (B). The ratios between the IFN-γ and IL-10 levels were calculated, and values are also shown (C). Bars represent the mean ± standard deviation of the groups. (*) indicates a statistically significant difference in relation to the saline and Mic/B groups (p < 0.001). (+) indicates a statistically significant difference in relation to the miltefosine, ICHQ, and ICHQ/Mic groups (p < 0.001).
Current usage metrics show cumulative count of Article Views (full-text article views including HTML views, PDF and ePub downloads, according to the available data) and Abstracts Views on Vision4Press platform.
Data correspond to usage on the plateform after 2015. The current usage metrics is available 48-96 hours after online publication and is updated daily on week days.
Initial download of the metrics may take a while.