Figure 2
Download original image
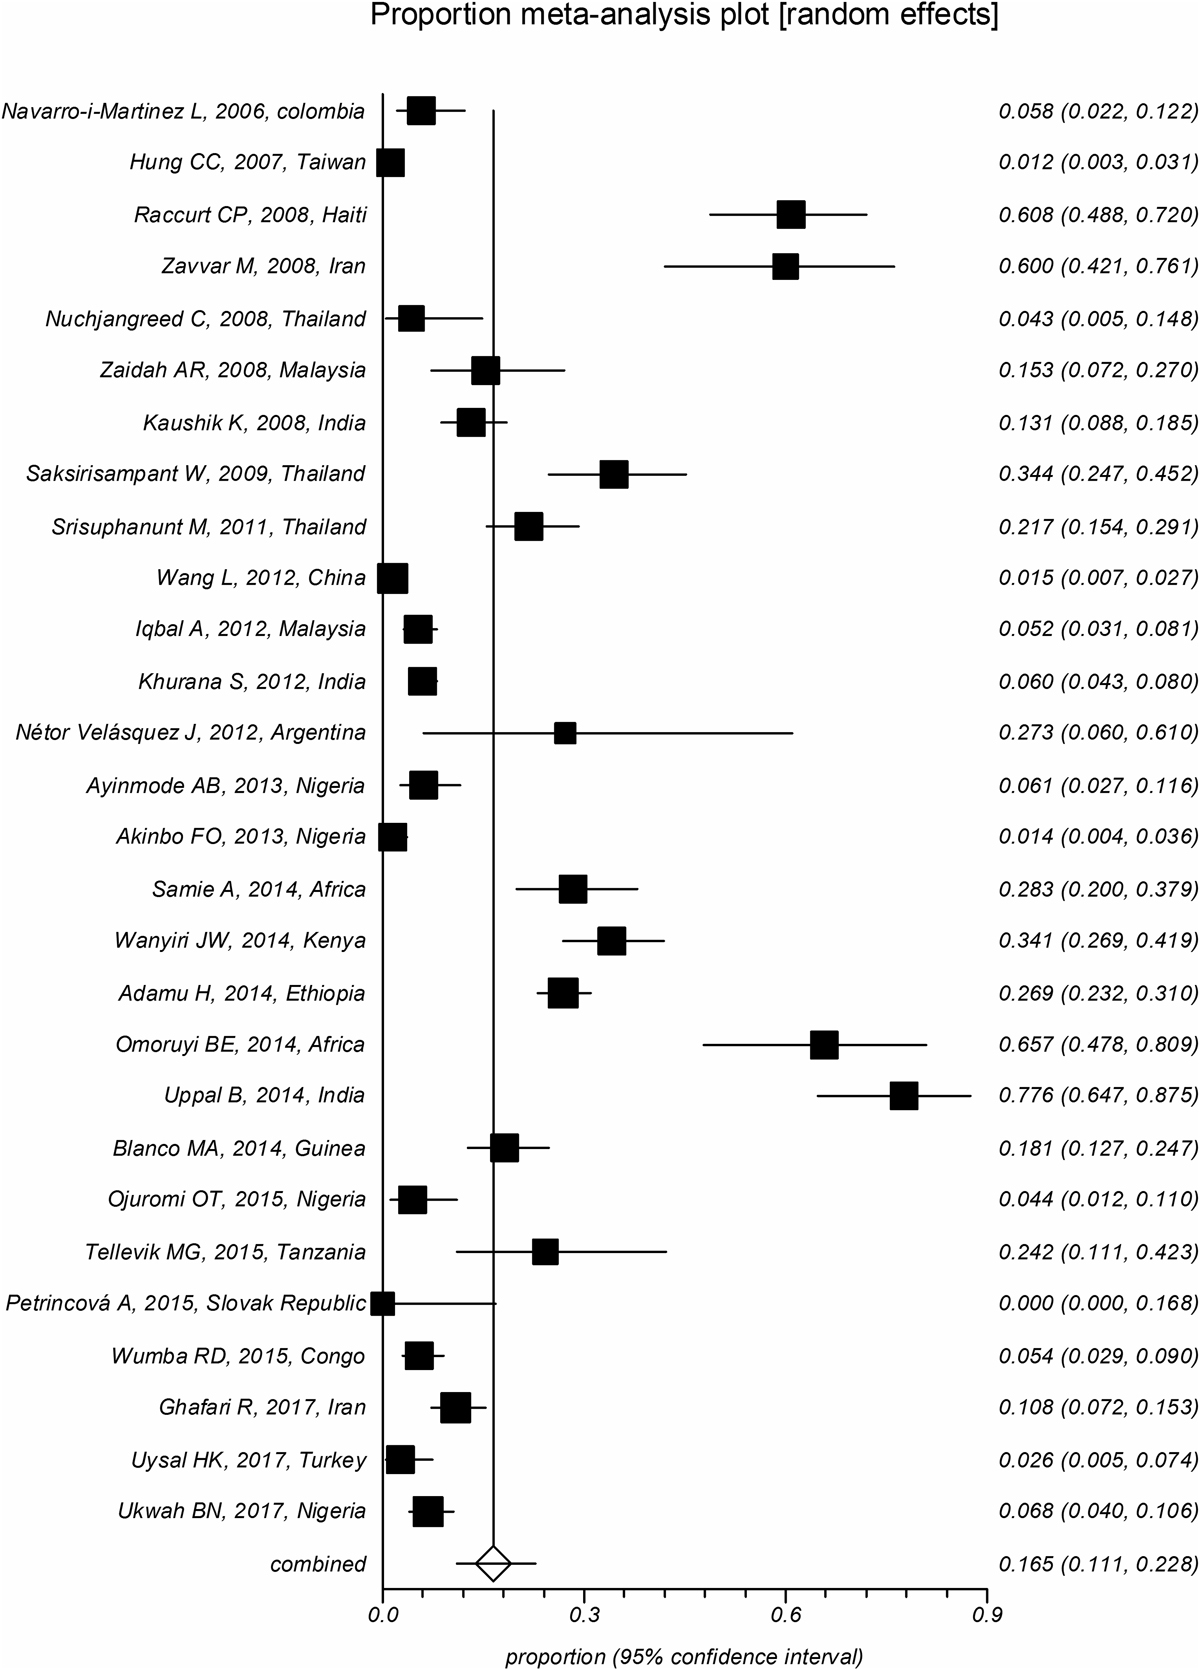
Forest plot diagram: The estimated pooled prevalence of Cryptosporidium infection in people with HIV infection by random-effect meta-analysis in included studies based on the PCR technique (first author, year of publication, and country). Note: The area of each square is proportional to the study’s weight in the meta-analysis, and each line represents the confidence interval around the estimate. The diamond represents the pooled estimate.
Current usage metrics show cumulative count of Article Views (full-text article views including HTML views, PDF and ePub downloads, according to the available data) and Abstracts Views on Vision4Press platform.
Data correspond to usage on the plateform after 2015. The current usage metrics is available 48-96 hours after online publication and is updated daily on week days.
Initial download of the metrics may take a while.