| Issue |
Parasite
Volume 33, 2026
|
|
|---|---|---|
| Article Number | 14 | |
| Number of page(s) | 18 | |
| DOI | https://doi.org/10.1051/parasite/2026013 | |
| Published online | 23 March 2026 | |
Supplementary material
 |
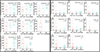
Supplementary file 1: SNP marker genotype structuring analysis based on average number of eggs in patients infected with S. haematobium. |
 |
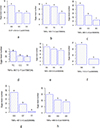
Supplementary file 2: Comparative analysis of urinary ECP (left) and plasma TNF-α concentrations (right) according to the genotypes identified for each marker in samples from patients infected with S. haematobium. |
© B.S.A.E. Savassi et al., published by EDP Sciences, 2026
Current usage metrics show cumulative count of Article Views (full-text article views including HTML views, PDF and ePub downloads, according to the available data) and Abstracts Views on Vision4Press platform.
Data correspond to usage on the plateform after 2015. The current usage metrics is available 48-96 hours after online publication and is updated daily on week days.
Initial download of the metrics may take a while.