| Issue |
Parasite
Volume 32, 2025
|
|
|---|---|---|
| Article Number | 45 | |
| Number of page(s) | 10 | |
| DOI | https://doi.org/10.1051/parasite/2025041 | |
| Published online | 25 July 2025 | |
Research Article
Effects of forest structure on the endoparasitism in roe deer Capreolus capreolus
Effets de la structure forestière sur l’endoparasitisme chez le chevreuil Capreolus capreolus
1
Université de Lyon, VetAgro Sup - Campus Vétérinaire de Lyon, Laboratoire de Parasitologie Vétérinaire, 69280 Marcy-L’Etoile, France
2
Université de Lyon, Université Lyon 1, CNRS, UMR 5558, Laboratoire de Biométrie et Biologie Évolutive, 69622 Villeurbanne, France
3
Office Français de la Biodiversité, Direction de la Recherche et de l’Appui Scientifique, Service « Conservation et Gestion des Espèces à Enjeux », « Montfort », 01330 Birieux, France
4
EA 7510, ESCAPE – Vecpar, UFR de Pharmacie, Université de Reims, Champagne-Ardenne, 51100 Reims, France
5
Office Français de la Biodiversité, Direction de la Recherche et de l’Appui Scientifique, Service « Conservation et gestion durable des espèces exploitées », 79360 Villiers-en-Bois, France
6
Office Français de la Biodiversité, Direction de la Recherche et de l’Appui Scientifique, Service « Santé de la faune et fonctionnement des écosystèmes agricoles », 31800 Villeneuve-de-Rivière, France
* Corresponding author: This email address is being protected from spambots. You need JavaScript enabled to view it.
Received:
5
December
2024
Accepted:
7
July
2025
Abstract
Parasitic infection by endoparasites is heterogeneous within a population. Such heterogeneity in parasitic status among individuals depends in particular on differences in their susceptibility to infection and in the habitats and resources used by the individuals. While several studies have aimed to identify individual factors and, mostly at large spatial scales, environmental factors that influence endoparasitism in wild populations, we aim in this study to investigate the influence of habitat quality (vegetation type, resource availability) on parasite burden within a population of roe deer living in a heterogeneous forest. We collected 1,469 fecal samples to measure the parasite burden on 952 roe deer captured between 1996 and 2020 in Chizé (France), a study site stratified into two contrasting sectors in terms of vegetation structure and resource quality. We quantified the effect of the sector on parasitism after considering the possible influences of age, sex, body mass and Julian date. The prevalence of parasitism was higher in individuals living in the poorer sector, but the intensity of the parasite burden was not influenced by the sector. These results suggest that within a host population, parasite infection risk would not be the same everywhere, probably due to differences in resource availability, vegetation species and density of host, showing the need to study parasitism at fine scales.
Résumé
L’infection parasitaire par les endoparasites est hétérogène au sein d’une population. Cette hétérogénéité du statut parasitaire entre individus dépend notamment des différences de sensibilité à l’infection et des habitats et ressources utilisés par les individus. Alors que plusieurs études ont cherché à identifier les facteurs individuels et, principalement à grande échelle spatiale, les facteurs environnementaux influençant l’endoparasitisme dans les populations sauvages, nous souhaitons, dans cette étude, étudier l’influence de la qualité de l’habitat (type de végétation, disponibilité des ressources) sur la charge parasitaire au sein d’une population de chevreuils vivant dans une forêt hétérogène. Nous avons collecté 1 469 échantillons fécaux afin de mesurer la charge parasitaire sur 952 chevreuils capturés entre 1996 et 2020 à Chizé (France), un site d’étude stratifié en deux secteurs contrastés en termes de structure de la végétation et de qualité des ressources. Nous avons quantifié l’effet du secteur sur le parasitisme après avoir pris en compte les influences possibles de l’âge, du sexe, de la masse corporelle et de la date julienne. La prévalence du parasitisme était plus élevée chez les individus vivant dans le secteur le plus pauvre, mais l’intensité de la charge parasitaire n’était pas influencée par le secteur. Ces résultats suggèrent qu’au sein d’une population hôte, le risque d’infection parasitaire ne serait pas le même partout, probablement en raison de différences de disponibilité des ressources, d’espèces végétales et de densité d’hôtes, ce qui souligne la nécessité d’étudier le parasitisme à des échelles fines.
Key words: Heterogeneity of infection / Endoparasites / Parasite distribution / Resources / Vegetation structure / Ungulate
Edited by: Emmanuel Liénard
© L. Bariod et al., published by EDP Sciences, 2025
 This is an Open Access article distributed under the terms of the Creative Commons Attribution License (https://creativecommons.org/licenses/by/4.0), which permits unrestricted use, distribution, and reproduction in any medium, provided the original work is properly cited.
Introduction
Studying the ecology of endoparasite populations is crucial to better understand and predict their impact on their hosts. In wild populations, multiple factors drive endoparasite circulation, including climatic and environmental influences on the biology of the parasite, as well as the host itself [3, 33]. With their complex life cycle (i.e., several hosts, passage in the environment between each host), the population dynamics of endoparasites are influenced by environmental conditions (e.g., population density and climatic effects) [14, 45], but also by the individual characteristics of their host (e.g., immune status, body condition and behavior) [10, 13, 30]. Endoparasite burdens are often studied at large spatial scales in wild populations [28, 32], for example by comparing different populations living in different habitats (e.g., [13, 24]), rather than testing for a potential spatial structure of the parasite burden within a population. Yet, at this scale, the structure of the infection can depend on several factors, e.g., on local environmental and climatic conditions and host populations [4, 31]. For example, Albery et al. [2] showed that the intensity of Fasciola hepatica in a red deer population seemed to be strongly influenced by the presence of wet grazing areas on a site of approximately 12 km2. It is therefore important to better understand the spatial patterns of infection, considering different scales.
One of the key factors that can influence fine-scale endoparasitism is the host itself, including its behavior and movements in the environment to acquire resources (i.e., dependent on the availability of food resources, their quality and competition for them) [26], but also its ability to eliminate a parasite. Indeed, when the quantity or quality of food resources are insufficient, the physical condition of individuals can be negatively impacted, leading to a decrease in their ability to control parasites [23]. Conversely, increased parasitism can occur when local host density is high or food resources are rare, implying that the hosts forage in the same location, increasing risk of parasite transmission in this area [19], as for several endoparasite species, their life cycle includes a free-living phase in the environment (e.g., trichostrongylids) [34]. Hence, the infection rate of a host may depend on its feeding behaviour and on its previous nutritional status, but also on the quality of the diet during the period of infection [43]. Therefore, within a population, individuals living in different types of habitat can have very different immune phenotypes and parasitic burden (i.e., sheep [33]; red deer [2]). Furthermore, the relationship between body condition and parasitic infections can be bidirectional: individuals with lower body condition may be more susceptible to parasitism due to weakened immune responses, while increased parasitism can lead to further deterioration in the host’s physical state [9]. Thus, individuals within a population, living in different habitats or with varying body conditions, may exhibit diverse immune phenotypes and parasitic burdens, as demonstrated in species such as sheep [30] and red deer [2].
At a fine scale, host parasite burden can also be influenced by the environmental conditions in which the parasites live, including for instance weather conditions and vegetation type. Climatic parameters such as temperature, humidity or exposure to UV rays can considerably influence the survival of parasites [22], but also their activity when they are in the free-living stage. For example, in digestive strongyles, rain or the amount of dew water are known to be decisive in ensuring the movement of larvae trapped inside the feces towards the grass [42]. Local meteorological conditions and microclimates, which can be influenced by vegetation, can directly influence the development, survival and dispersal of free-living stages of endoparasites (e.g., for gastro-intestinal strongyles [34]) or their intermediate hosts (e.g., snails and slugs for protostrongylids). Parasites develop and survive better in microhabitats with humidity and low exposure to excessively extreme climatic conditions (e.g., high heat or drought). However, although the influence of weather conditions on endoparasites is well documented, studies on the influence of vegetation cover on endoparasitism are scarce in the literature, particularly in forest environments and at fine scale. To our knowledge, no studies have investigated the influence of forest structure and the quality of resources for hosts on their endoparasite burden in a forested environment.
We aimed in this study to investigate the influence of forest structure as a spatial determinant of the parasite burden within a host population living in a habitat with variable environmental conditions. Using fecal samples, we measured parasite burden of four groups of parasites (i.e., gastro-intestinal strongyles, Trichuris sp., Eimeria spp. and protostrongylids) in a roe deer (Capreolus capreolus) population living in Chizé. This study site in France has two sectors of contrasting habitat quality [38], i.e., variable quantity and quality of resources. Previous studies in Chizé have also shown that individuals living in the richest part of the study site have higher body mass [37, 38], reflecting spatial heterogeneity in body condition of roe deer. We can therefore expect that the endoparasite burden of roe deer would differ depending on forest cover and predicted that this burden, in terms of prevalence and intensity, would be higher in individuals facing poor environmental conditions such as low availability of resources, compared to individuals living in richer environments.
Material and methods
Ethics approval
This research was conducted with the approval of the French authorities (French Ministry of Environment) and performed in accordance with the conditions detailed in the specific accreditation issued to the “Office Français de la Biodiversité” by the “Préfecture de Paris” (Agreement No. 2009–014, No. 2013–118, and No. 2019-02-19-003). The experiments were carried out by respecting the European and French laws defined for the ethical use of animals in research.
Study site and habitat quality
This work was conducted on the population of roe deer living in the “Réserve Biologique Intégrale of Chizé”, an enclosed forest of 2,614 ha managed by the “Office National des Forêts”. This study site is located in western France (46° 50’ N, 0° 25’ E) (Fig. 1), where the climate is oceanic with mild winters and hot, dry summers.
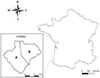 |
Figure 1 Maps of the study site of Chizé stratified into two habitats with its location in France. On the left: the two sectors characterized as richer (R) and poorer (P). This figure was carried out using Qgis 3.16 software. |
The forest of Chizé presents low productivity due to poor quality of the soil and the frequent summer droughts. Moreover, based on a geological map [29], the distribution of the main plant/tree species and the nitrogen content of the plants [37], we determined two habitats of contrasting quality within the reserve [38]. This spatial pattern at this study site is an opposition between the north-eastern area and the rest of the reserve (north-western and southern areas) (Fig. 1). The north-eastern area, composed by oak (Quercus sp.) and hornbeam (Carpinus betulus) as the dominant species associated with hawthorn (Crataegus monogyna), dogwood (Cornus spp.), and maple (Acer sp.) (many herbaceous plants, mainly and/or preferred food eaten by the roe deer during spring or summer) [18], is the richest area in terms of resources, also reflected by a greater mass of fawns compared to the other part of reserve [36]. The other part of the study site is considered poorer and is stratified into two habitat types: the north-western part which is represented by oak (Quercus sp.), maple (Acer sp.) with butcher’s broom (Ruscus aculeatus), and the south part which mainly contains beech (Fagus sylvatica) and which is the poorest habitat in Chizé. Thus, for the following analyses, we will use the term “sector” to define these two types of habitat at Chizé: “sector R” for the north-eastern area (richer area), “sector P” for the north-western and southern areas (poorer area) (Fig. 1).
Data collection
Data on roe deer were collected during a Capture-Mark-Recapture program. Since 1977, roe deer captures by drive-netting have taken place every winter (January–March) in Chizé, with 10–12 capture days per year (see [21] for further details). Once animals were captured, experiments were performed between 1 and 4 h and information was recorded or biological samples collected, e.g., age, sex, body mass (in kg, to the nearest 0.05 g) and fecal matter (used to measure parasite burden). In this study, we used data only from individuals of known age (i.e., captured within their first year of life) in the period from 1996 to 2020, except for the year 2000 (no captures carried out after the hurricane “Lothar” of 1999) [21] and the years from 2003 to 2007 (no data collected on parasitism in roe deer).
The total dataset consisted of 1,469 measurements from 952 individuals of known age (n = 418, 819 and 232 measurements on 1, 2–7 and 8–17-years old individuals, respectively). Among the 952 roe deer studied, 655 were captured once, 165 twice, 77 three times, 31 four times, and 24 five to seven times. Furthermore, these numbers are indicative of the total dataset, but the number of data used to make the analyses was dependent on the measure of parasitism used. Approximately 60% of roe deer were captured in the R sector and 40% in the P sector. For roe deer close to the boundary of the two sectors, we assigned the sector most used by the animal based on accurate telemetry monitoring in the field. Each age was represented in each sector, except an individual of 16 years in sector P (see the distribution of data by age and by sector on Figure S1). The sex-ratio in each sector was approximately balanced (sector R: 51% females, 49% males; sector P: 54% females, 46% males). Moreover, roe deer with on average higher body condition were in sector R [19.67 ± 4.46 kg] rather than in the sector P [18.97 ± 4.85 kg] (Mann & Whitney, W = 357029, p-value = 0.005).
Measures of parasite burden
At Chizé, in roe deer, we had several categories of eggs or larvae identifiable during the analysis of feces: lung parasites, the protostrongylids (nematodes), and digestive tract parasites such as Eimeria spp. (coccidian: Protozoa) and nematodes, i.e., gastrointestinal strongyles (GI strongyles, including several species belonging mostly to Trichostrongylidae family [8]) and Trichuris sp. We considered feces eggs/larval count as a marker of positivity to the parasite (i.e., classic estimation in domestic ruminants to assess parasitic infections). Fecal samples were analysed with the Baermann technique [6] to isolate and count the first stage larvae of pulmonary nematodes in larvae per gram of feces (lpg). We also performed a modified McMaster protocol [40] with a flotation solution of magnesium sulfate (MgSO4, s.g. = 1.26; 1996–2013) or zinc sulfate (ZnSO4, s.g. = 1.36; 2014–2020) to count the number of eggs/oocysts per gram of feces (epg/opg for digestive parasites, i.e., helminths and coccidian). Briefly, for each sample, we mixed 2.5–5 g of feces with the flotation solution (1:15 dilution ratio). We then homogenized the solution and sampled 1 mL that was loaded on a McMaster slide with two chambers. We thus counted the number of parasite propagules in the whole chambers (quantitative examination; theoretical sensitivity of 15 epg/opg). We also centrifuged a 14 mL tube with the remaining solution, covered with a coverslip. We thus placed the coverslip on a microscope slide before searching with a microscope (lens: ×10) for the presence of parasite propagules (“control slide”; qualitative examination). We attributed the value of 7.5 epg/opg (rounded up to the nearest whole number for statistical analyses) to parasites with no eggs/oocyst observed on the McMaster slide, but at least one egg/oocyst observed on the control slide.
Statistical analyses
Response variables
To assess parasite infections in roe deer according to different factors, we used two measures of the level of parasitism in a host as response variables: a) parasite prevalence assessed by the individual presence/absence of parasites propagules; b) parasite intensity estimated by the number of fecal parasite propagules in infested individuals only. We only considered the most prevalent parasites in the population of Chizé: GI strongyles, Trichuris sp, Eimeria spp. and protostrongylids. We ran separate analyses for each parasite and measure of the level of parasitism. We analyzed prevalence using a generalized linear mixed model (GLMM) with a binomial error. For the intensity analysis, parasite egg count distributions are non-normal and strongly overdispersed. Just like the Poisson model, the negative binomial model is commonly utilized as a distribution to model such count data; it allows a variance higher than its mean. Using the “descdist” function from the “fitdistrplus” package [16], we confirmed that GI strongyles, Trichuris sp. and Eimeria spp. intensities followed a negative binomial distribution. However, it did not fit for protostrongylids intensities. This variable was thus log-transformed as log10(x + 1) to obtain a normal distribution and analyzed using linear mixed models (LMM). Moreover, the intensity of Eimeria spp. had about ten extreme values above 4,000 opg (e.g., 210,000 opg); we therefore rounded all these values to 4,000 opg to improve the distribution.
Explanatory variables
We included in the models all the variables known to possibly affect parasite burden in roe deer: age, sex, body mass and Julian date. We accounted for possible effects of age (linear or quadratic effect, determined by model selection and in accordance with the publication of [13]) and sex because previous work has shown that in roe deer, juveniles and males are more infested than adults and females [10]. Moreover, roe deer with lower body mass are more parasitized than individuals with higher body mass [7, 10, 13], thus we considered this variable in our model. Body mass measured in young individuals (i.e., first year of life) depends on the date of capture (gain on average 12 g/day during the capture period) [17] and on the sector in Chizé (up to 2 kg difference in the mass of fawns between sector R and sector P in Chizé) [36]. Therefore, we standardized juvenile body mass with Julian date and sector by taking residuals of a linear model. For adult roe deer (i.e., ≥ 2 years old), body mass depends on the sex (males are heavier than females, Mann & Whitney test: n = 1162, W = 11986, p-value < 0.001), on the age (body mass does not change between the ages of 4 and 10 years in both males and female [38] but we need to control for 2, 3 and after 10 years old) and on the sector. We thus standardized the adult body mass by these parameters (linear effect of age and categorical effect of sector) by taking residuals of a linear model. The Julian date of capture (Day 1 = January 1st) was also added to control for potential among-individual differences in parasite burden and body mass due to the timing of sampling. The median day of sampling was day 37 of the year corresponding to February 7th [January 7th; March 13th] 95% CI.
To avoid pseudo-replication problems [25], we included the factors individual identity (i.e., individuals can be captured between 1 and 10 times in our dataset) and year of capture as random effects. This allowed us to control for unexplained variance due to among-individual and inter-annual variations (including the potential influence of changing the flotation solution – MgSO4 and ZnSO4 – to measure parasitism during the study period).
To test our prediction, we performed model selection for each group of parasites and parasitism measure (intensity and prevalence) by fitting a null model (measure of parasite burden ~ age + sex + body mass + Julian date + 1|year of capture + 1|individual identity) including all the previously described variables and we compared this model (“null model”) to a model (“sector model”) also including the sector of capture (two categories: R and P), as a marker of local resources quality and quantity (i.e., habitat quality).
Model selection
Based on the “corrected” Akaike’s information criteria (AICc) [12], we selected the best model describing variation of each parasite prevalence/intensity by comparing complete and null models (Table 1). For each response variable, we retained the model with the lowest AICc. When competing models differed in AICc (ΔAICc) by less than two, we retained the most parsimonious one, i.e., the model with fewer parameters. Finally, we assessed the goodness of fit by calculating the marginal (R2m; variance explained only by fixed effects) and conditional (R2c; variance explained by the entire model) variances using the r.squaredGLMM function of the MuMIN package (Bartoń 2019). For each model selected, the normality of the residuals was evaluated visually.
Prevalence (% presence) and intensity of: GI strongyles (egg/g of feces), Trichuris sp. (egg/g of feces), Eimeria spp. (oocyst/g of feces), protostrongylids (larvae/g of feces) according to the sector of Chizé as well as the total at the site.
All statistical analyses were performed using R (version 4.2.2) [39]. We fitted models using the functions lmer, glmer and glmernb from package lme4. Significance threshold was set at the α = 0.05 level. Maps were performed using Qgis 3.16 software.
Results
Data description
The most prevalent parasites in roe deer in Chizé were GI strongyles and Trichuris sp., observed in more than half of the individuals (56% and 55%, respectively), while Eimeria spp. and protostrongylids were less prevalent (37% and 23%, respectively). In terms of parasite intensity, the mean number of eggs/oocysts/larvae per gram of feces ± standard deviation was: 63.0 ± 115.6 epg for GI strongyles (n = 1,469), 307.4 ± 812.3 epg for Trichuris sp. (n = 1,466), 1152.6 ± 12138.5 opg for Eimeria spp. (n = 1,467) and 30.9 ± 103.2 lpg for protostrongylids (n = 1,422).
Parasitic prevalence
Globally, a higher parasite prevalence was observed in roe deer living in sector P (Table 1). Based on model selection, parasitic prevalence (GI strongyles, Trichuris sp. and Eimeria spp.) was best described by the models including the sector effect (ΔAICc > 2; Table 2), except for the protostrongylids (ΔAICc < 2; Table 2). However, for this parasite, the two models had a very close AICc (ΔAICc = 0.5).
Performance of linear and generalized linear mixed models (sector and null models) to explain the variation in the prevalence and intensity of each group of parasites according to different predictors in fixed effect (age, sex, body mass, Julian date and sector) and in random effect (year of capture and individual identity). The best model (in bold) is the model reflecting the best compromise between accuracy and complexity of the model. ΔAICc is the difference in AICc between the two models.
As expected, a negative effect of body mass on prevalence was found for each parasite (Table 3), meaning that individuals with lower mass were more parasitized overall. Age was also a factor structuring the prevalence of GI strongyles, Eimeria spp. and protostrongylids (Table 3), with young roe deer (1 year old) being more often parasitized compared to adults and old individuals (see Figure S2). Julian date also had a significant effect on the prevalence of Trichuris sp. and Eimeria spp. with a higher prevalence later in the catching season. Finally, only the prevalence of Trichuris sp. was sex-specific, with males being more parasitized than females.
Best model set descriptions and extracted values for the prevalence of each parasite species. In bold: significant effect (p-value < 0.05) of the predictor in each model.
Parasitic intensity
Parasitic intensity for protostrongylids tended to be higher in roe deer in sector P than in sector R, while for GI strongyles and Eimeria spp. the difference was low, and for Trichuris sp., roe deer in sector P tended to have lower average intensity of infection than in sector R (Table 1).
Based on model selection, parasitic intensity was best described by the null models (i.e., without the sector effect) for three groups of parasites, except Trichuris sp. (Table 1). For GI strongyles and Eimeria spp., the models including the sector effect had close AICc (ΔAICc = 1.3 and 1.1, respectively) with the null models. For Trichuris sp., the intensity was higher in sector P, but not significantly (p = 0.13). As for models selected on prevalence, a negative effect of body mass on the intensity was found for each parasite (Table 4), meaning that individuals with lower body mass had overall higher intensities of parasites. Age was also a factor structuring the intensities of all parasites except GI strongyles (Table 4), with young roe deer (1 year old) having higher intensities of parasites than adults and older individuals (2–17 years old). Julian date and sex had no significant effects on parasitic intensities.
Best model set descriptions and extracted values for the intensity of each parasite species. In bold: significant effect (p-value < 0.05) of the predictor in each model.
Discussion
Understanding the spatial pattern of parasite burden in large mammals often depends on environmental conditions, such as the habitat and climatic/micro-climatic conditions where hosts and parasites are found. This study aimed to assess whether differences in forest structure and sector-based habitat quality influenced parasite burden in roe deer within the Chizé study site. We provided evidence that the level of parasitism varied among the two sectors with contrasted habitat quality in Chizé, after considering possible confounding effects of phenotypic attributes. Interestingly, we observed a higher prevalence of parasites in individuals living in the sector with poor habitat quality compared to high-quality habitat. However, our results do not seem to show an effect of sector on parasite intensity.
First, considering effects of phenotypic attributes in our models, we found mainly the effects of body condition and age on parasite burden. Higher parasite prevalence (GI strongyles, Eimeria spp., protostrongylids) and higher parasite intensity (Trichuris sp., Eimeria spp., protostrongylids) were found in younger roe deer, which is generally in agreement with the results shown in the studies of Body et al. [10] and Cheynel et al. [13]. Body condition was also a factor that emerged in all our models, showing that roe deer in poorer body condition were more parasitized by all parasites studied. This result is consistent with other studies on roe deer parasitism [10, 13]. Regarding sex, this factor only emerged once in our models, with a higher prevalence of Trichuris sp. in males. At Chizé, it is therefore assumed that sex does not appear to be a dominant factor driving parasite burden, probably because other determinants of parasitism are more important, such as age or body condition, or environment and habitat sector.
Our results showed that roe deer were more often parasitized in sector P (Table 2). This could be explained by the lower immune capacities of the roe deer against parasites in this sector compared to the individuals in sector R. An individual needs energy to ensure various physiological functions, such as growth and reproduction, which prevents the exclusive allocation of resources to immune defenses [46]. The quality and availability of food resources strongly determine the allocation of energy to immune defence, with defences being improved when the resources are richer and more abundant [27, 35]. In Chizé, with contrasted quality of habitat (quality or quantity of resources) in the two sectors, heavier roe deer were found in sector R (19.67 ± 4.46 kg) than in sector P (18.97 ± 4.85 kg). In addition to oaks, the richer sector is composed of hornbeam, hawthorn and dogwood, associated with herbaceous species such as bluebells (Hyacinthoides nonscripta L.) or Pyrenees star of Bethlehem (Ornithogalum pyrenaicum L.), which are highly appreciated by roe deer [18, 37]. These plants are more frequent in this sector and are known to have a high nitrogen content [37], making sector R a habitat with generally richer resources for roe deer. This could explain why roe deer in sector P have higher parasite prevalence. In addition, parasites can reduce the host’s body condition by spoliating resources and reducing its appetite. Parasites will thus negatively influence the body condition of their host, proportionally to the level of infestation. This could explain the negative covariance between body mass and parasitism we observed here and in previous studies, e.g., [5, 10, 11, 44]. As a result, hosts will be even less able to defend themselves, which could lead in higher parasitic infestation and further deterioration of its body condition and a “vicious circle” is created [9]. A study has, for example, shown that the presence of parasites increases the reduction of trace elements such as copper, iron or even zinc, essential for intestinal immunity, and thus influence the expression of disease [1, 15]. Therefore, parasitized individuals are more likely to be negatively affected if they do not have the energy resources necessary to defend themselves.
The higher parasite prevalence in sector P (Table 1) could also come from a higher rate of encounters with parasites in the environment or with infested hosts, due to the structure/composition of the forest and roe deer behavior and density. As mentioned above, sector R is mainly composed of oaks, hornbeams, hawthorns, dogwoods and herbaceous species, while sector P contains oaks but also other forest species such as maple or beech, and in particular many more butcher’s broom (Ruscus aculeatus). This denser vegetation creates a more closed environment in sector P [36], particularly due to the extensive presence of butcher’s broom (pers. obs.), which may create microhabitats with higher humidity. Such conditions are known to promote the development, migration and survival of free-living stages of some parasites (e.g., strongyles [34]) or intermediate hosts (e.g., snails and slugs for Protostrongylids) that require moist environments for development. Although few studies have directly assessed the influence of vegetation structure and microclimate on parasite transmission in roe deer, Body et al. [10] reported a positive relationship between summer rainfall and gastro-intestinal strongyles intensity in female roe deer, supporting the idea that moisture-related factors can influence infection dynamics in this species. However, groups and species of parasites have different sensitivity to environmental conditions, and heterogeneity in habitat and microclimate can be high within each sector. Refining identification of parasites (e.g., identification of the different parasite species rather than considering groups of parasites such as GI strongyles) and the vegetation structure (cover and vegetation species) could help to better understand the dynamic of infection in the different sectors. Regarding the behavior of roe deer, given that sector P is a poorer habitat, roe deer can move further to find resources. A study by Saïd et al. [41] has shown that female roe deer living in low quality areas adjusted the size of their home range to include more patches of habitat and compensate for the lack of resources. Thus, intraspecific competition for resources could be present in the same part of the sector. The roe deer in this sector may move further to find resources and therefore encounter more areas where other infected roe deer have defecated and where infesting larvae are present, increasing the risk of being infested.
Finally, the density of a host population is also known to influence their level of parasitism [10]. Unfortunately, we have no recent information on roe deer density in each sector, but we know that in a heterogeneous environment, individuals are expected to distribute in an ideal free manner, with higher density of individuals in the richer habitats, so that resources are partitioned equally among individuals [20]. Previous works have shown that there is a heterogeneity of habitat in Chizé and that roe deer follow this rule, with higher density of individuals in the richer sector [36, 37]. Local density could therefore not explain the higher prevalence of parasites in sector P. However, this could help us to understand the lack of differences in parasitic infestation between the two sectors, with higher environmental parasitic pressure associated with higher density in sector R, counterbalancing higher sensitivity to infection associated with low resource quality and quantity in sector P.
Conclusion
To conclude, the results of this study are consistent with other works on the subject, showing that parasitism can be dependent on quality of habitat [2, 31, 33], even in a predominantly forested environment. The spatial trend seen (mainly in prevalence) demonstrates that higher or lower parasitism can be associated with different sectors of a given study system, signifying that uneven sampling in space could introduce confounding variation and bias. It is, however, difficult to understand the influence of host density, habitat and resources on the abundance of endoparasites, in particular because it is difficult to disentangle their direct effect on parasite replication from their indirect effect on pathogen mortality, mediated by the immune system. Furthermore, while seasonal variation and the longevity of infective parasite stages in the environment could play a significant role in parasite dynamics, our study was, unfortunately, limited by the lack of data on these environmental stages and the duration of infection in individual roe deer. As such, our findings represent a snapshot of infection status at the time of sampling, rather than reflecting long-term infection dynamics. Future studies should integrate different aspects of host density, and immune, physiological and behavioral responses at even finer spatial scales to better identify the mechanisms of parasite transmission and maintenance in a host population. At the same time, it would be interesting to study the vegetation species and diet (quality: N, P, C and minerals) of the host population according to habitat structure, but also to define the local density according to sector, as the density of the host population can have an impact on parasite infection in a population.
Acknowledgments
We are especially grateful to the technicians of Chizé (Guy Van Laere and Gilles Capron), and all volunteers for their help during captures, as well as Maryline Pellerin for her coordination of scientific studies. We would like to thank Jérôme Depaquit, Damien Jouet, Monique Boutry and Anne Segonds-Pichon for their help during coproscopic analyses. The authors thank VetAgro Sup and the Office Français de la Biodiversité for funding this study (partnership agreement CNV20.0943).
Conflicts of interest
The authors declare that they have no conflict of interest.
Author contribution statement
LB, GB and SS conceived and designed the study. JD, SP and HB conducted fieldwork. HF and SB performed experiments to acquire data. LB performed statistical analyses on the data and wrote the original draft. GB, SS and HF provided editorial advice.
Supplementary material
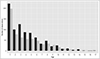 |
Figure S1: Number of observations according the age of roe deer and the sector. Black, sector R; light grey, sector P. |
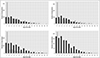 |
Figure S3: Presence/absence of a) Gastrointestinal strongyles, b) Trichuris sp., c) Eimeria spp. and d) Protostrongylids in roe deer according to the age of individuals. Black, absence of parasites; Light grey, presence of parasites. |
References
- Adogwa A, Mutani A, Ramnanan A, Ezeokoli C. 2005. The effect of gastrointestinal parasitism on blood copper and hemoglobin levels in sheep. Canadian Veterinary Journal, 46, 1017–1021. [Google Scholar]
- Albery GF, Becker DJ, Kenyon F, Nussey DH, Pemberton JM. 2019. The fine-scale landscape of immunity and parasitism in a wild ungulate population. Integrative and Comparative Biology, 59, 1165–1175. [Google Scholar]
- Albery GF, Morris A, Morris S, Pemberton JM, Clutton-Brock TH, Nussey DH, Firth JA. 2021. Multiple spatial behaviours govern social network positions in a wild ungulate. Ecology Letters, 24, 676–686. [Google Scholar]
- Albery GF, Sweeny AR, Becker DJ, Bansal S. 2022. Fine-scale spatial patterns of wildlife disease are common and understudied. Functional Ecology, 36, 214–225. [Google Scholar]
- Aleuy OA, Ruckstuhl K, Hoberg EP, Veitch A, Simmons N, Kutz SJ. 2018. Diversity of gastrointestinal helminths in Dall’s sheep and the negative association of the abomasal nematode, Marshallagia marshalli, with fitness indicators. PloS One, 13, e0192825. [Google Scholar]
- Baermann G. 1917. Eine einfache methode zur auffindung von Ankylostomum (Nematoden) larven in erdproben. Geneeskunding Tijdschrift Voor Nederlandsch-Indië, 57, 131–137. [Google Scholar]
- Bariod L, Saïd S, Calenge C, Scheifler R, Fritsch C, Peroz C, Benabed S, Bidault H, Chabot S, Débias F, Duhayer J, Pardonnet S, Poirel M-T, Revelli P, Vuarin P, Bourgoin G. 2024. Essential mineral elements in roe deer: Associations with parasites and immune phenotypes in two contrasting populations. Ecology and Evolution 14, e11613. [Google Scholar]
- Beaumelle C, Redman EM, de Rijke J, Wit J, Benabed S, Debias F, Duhayer J, Pardonnet S, Poirel M-T, Capron G, Chabot S, Rey B, Yannic G, Gilleard JS, Bourgoin G. 2021. Metabarcoding in two isolated populations of wild roe deer (Capreolus capreolus) reveals variation in gastrointestinal nematode community composition between regions and among age classes. Parasites & Vectors 14, 594. [Google Scholar]
- Beldomenico PM, Begon M. 2010. Disease spread, susceptibility and infection intensity: vicious circles? Trends in Ecology & Evolution, 25, 21–27. [Google Scholar]
- Body G, Ferté H, Gaillard J-M, Delorme D, Klein F, Gilot-Fromont E. 2011. Population density and phenotypic attributes influence the level of nematode parasitism in roe deer. Oecologia, 167, 635–646. [Google Scholar]
- Bourgoin G, Portanier E, Poirel M-T, Itty C, Duhayer J, Benabed S, Cockenpot A, Callait-Cardinal M-P, Garel M. 2021. Reproductive females and young mouflon (Ovis gmelini musimon × Ovis sp.) in poor body condition are the main spreaders of gastrointestinal parasites. Parasitology, 148, 809–818. [Google Scholar]
- Burnham KP, Anderson DR. 2002. Model selection and multimodel inference: a practical information-theoretic approach, 2nd edn. Springer-Verlag: New York. [Google Scholar]
- Cheynel L, Lemaître J-F, Gaillard J-M, Rey B, Bourgoin G, Ferté H, Jégo M, Débias F, Pellerin M, Jacob L, Gilot-Fromont E. 2017. Immunosenescence patterns differ between populations but not between sexes in a long-lived mammal. Scientific Reports, 7, 13700. [Google Scholar]
- Costamagna AC, Menalled FD, Landis DA. 2004. Host density influences parasitism of the armyworm Pseudaletia unipuncta in agricultural landscapes. Basic and Applied Ecology, 5, 347–355. [Google Scholar]
- Dautremepuits C, Paris-Palacios S, Betoulle S, Vernet G. 2004. Modulation in hepatic and head kidney parameters of carp (Cyprinus carpio L.) induced by copper and chitosan. Comparative Biochemistry and Physiology Part C: Toxicology & Pharmacology, 137, 325–333. [Google Scholar]
- Delignette-Muller ML, Pouillot R, Denis J-B, Dutang C. 2023. fitdistrplus: help to fit of a parametric distribution to non-censored or censored data R package version 1.1-3. Available at https://CRAN.R-project.org/package=fitdistrplus. [Google Scholar]
- Douhard F, Gaillard J-M, Pellerin M, Jacob L, Lemaître J-F. 2017. The cost of growing large: costs of post-weaning growth on body mass senescence in a wild mammal. Oikos, 126, 1329–1338. [Google Scholar]
- Duncan P, Tixier H, Hofmann RR, Lechner-Doll M. 1998. Feeding strategies and the physiology of digestion in roe deer, in: The European Roe Deer: the Biology of Success, Andersen R, Duncan P, Linnell JDC, Editor. Scandinavian University Press: Oslo. p. 376. [Google Scholar]
- Feldhamer GA, Merritt JF, Krajewski C, Rachlow JL, Stewart KM. 2020. Mammalogy: adaptation, diversity, ecology. JHU Press: Baltimore, Maryland. [Google Scholar]
- Fretwell S, Lucas HL. 1970. On territorial behaviour and other factors influencing habitat distribution in birds. I. theoretical development. Acta Biotheoretica 19, 16–36. [Google Scholar]
- Gaillard J-M, Delorme D, Boutin J-M, Van Laere G, Boisaubert B, Pradel R. 1993. Roe deer survival patterns: a comparative analysis of contrasting populations. Journal of Animal Ecology, 62, 778–791. [Google Scholar]
- Gibbs HC. 1982. Mechanisms of survival of nematode parasites with emphasis on hypobiosis. Veterinary Parasitology, 11, 25–48. [Google Scholar]
- Gortázar C, Ferroglio E, Höfle U, Frölich K, Vicente J. 2007. Diseases shared between wildlife and livestock: a European perspective. European Journal of Wildlife Research, 53, 241–256. [Google Scholar]
- Horcajada-Sánchez F, Navarro-Castilla Á, Boadella M, Barja I. 2018. Influence of livestock, habitat type, and density of roe deer (Capreolus capreolus) on parasitic larvae abundance and infection seroprevalence in wild populations of roe deer from central Iberian Peninsula. Mammal Research, 63, 213–222. [Google Scholar]
- Hurlbert SH. 1984. Pseudoreplication and the design of ecological field experiments. Ecological Monographs, 54, 187–211. [Google Scholar]
- Johnson MD. 2007. Measuring habitat quality: a review. Condor, 109, 489–504. [Google Scholar]
- Klemola N, Klemola T, Rantala MJ, Ruuhola T. 2007. Natural host-plant quality affects immune defence of an insect herbivore. Entomologia Experimentalis et Applicata, 123, 167–176. [Google Scholar]
- Kołodziej-Sobocińska M. 2019. Factors affecting the spread of parasites in populations of wild European terrestrial mammals. Mammal Research, 64, 301–318. [Google Scholar]
- Lambertin V. 1992. Carte géologique de la forêt domaniale de Chizé, in: Révision de l’aménagement de la forêt domaniale de Chizé, Office National des Forêts: Paris. [Google Scholar]
- Moore J. 2002. Parasites and the behavior of animals. Oxford University Press: Oxford. [Google Scholar]
- Murdock CC, Evans MV, McClanahan TD, Miazgowicz KL, Tesla B. 2017. Fine-scale variation in microclimate across an urban landscape shapes variation in mosquito population dynamics and the potential of Aedes albopictus to transmit arboviral disease. PLOS Neglected Tropical Diseases, 11, e0005640. [Google Scholar]
- Murray KA, Olivero J, Roche B, Tiedt S, Guégan J-F. 2018. Pathogeography: leveraging the biogeography of human infectious diseases for global health management. Ecography, 41, 1411–1427. [Google Scholar]
- Musella V, Catelan D, Rinaldi L, Lagazio C, Cringoli G, Biggeri A. 2011. Covariate selection in multivariate spatial analysis of ovine parasitic infection. Preventive Veterinary Medicine, 99, 69–77. [Google Scholar]
- O’Connor LJ, Walkden-Brown SW, Kahn LP. 2006. Ecology of the free-living stages of major trichostrongylid parasites of sheep. Veterinary Parasitology, 142, 1–15. [CrossRef] [PubMed] [Google Scholar]
- Ojala K, Julkunen-Tiitto R, Lindström L, Mappes J. 2005. Diet affects the immune defence and life-history traits of an Arctiid moth Parasemia plantaginis. Evolutionary Ecology Research, 7, 1153–1170. [Google Scholar]
- Pettorelli N, Dray S, Gaillard J-M, Chessel D, Duncan P, Illius A, Guillon N, Klein F, Van Laere G. 2003. Spatial variation in springtime food resources influences the winter body mass of roe deer fawns. Oecologia, 137, 363–369. [Google Scholar]
- Pettorelli N, Gaillard J-M, Duncan P, Ouellet J-P, Van Laere G. 2001. Population density and small-scale variation in habitat quality affect phenotypic quality in roe deer. Oecologia, 128, 400–405. [Google Scholar]
- Pettorelli N, Gaillard J-M, Van Laere G, Duncan P, Kjellander P, Liberg O, Delorme D, Maillard D. 2002. Variations in adult body mass in roe deer: the effects of population density at birth and of habitat quality. Proceedings of the Royal Society of London. Series B: Biological Sciences, 269, 747–753. [Google Scholar]
- R Core Team. 2022. R: a language and environment for statistical computing. Vienna, Austria. Available at https://www.R-project.org/. [Google Scholar]
- Raynaud J-P, William G, Brunault G. 1970. Étude de l’efficacité d’une technique de coproscopie quantitative pour le diagnostic de routine et le contrôle des infestations parasitaires des bovins, ovins, équins et porcins. Annales de Parasitologie Humaine et Comparée, 45, 321–342. [Google Scholar]
- Saïd S, Gaillard J-M, Widmer O, Débias F, Bourgoin G, Delorme D, Roux C. 2009. What shapes intra-specific variation in home range size? A case study of female roe deer. Oikos, 118, 1299–1306. [Google Scholar]
- Santos MC, Silva BF, Amarante AFT. 2012. Environmental factors influencing the transmission of Haemonchus contortus. Veterinary Parasitology, 188, 277–284. [Google Scholar]
- Scrimshaw N, SanGiovanni J. 1997. Synergism of nutrition, infection, and immunity: an overview. American Journal of Clinical Nutrition, 66, 464S–477S. [Google Scholar]
- Stien A, Irvine RJ, Ropstad E, Halvorsen O, Langvatn R, Albon SD. 2002. The impact of gastrointestinal nematodes on wild reindeer: experimental and cross-sectional studies. Journal of Animal Ecology, 71, 937–945. [Google Scholar]
- Yan C, Liang L-J, Zheng K-Y, Zhu X-Q. 2016. Impact of environmental factors on the emergence, transmission and distribution of Toxoplasma gondii. Parasites & Vectors, 9, 137. [CrossRef] [PubMed] [Google Scholar]
- Zuk M, Stoehr AM. 2002. Immune defense and host life history. American Naturalist, 160, S9–S22. [Google Scholar]
Cite this article as: Bariod L, Saïd S, Ferté H, Benabed S, Bidault H, Duhayer J, Pardonnet S & Bourgoin G. 2025. Effects of forest structure on the endoparasitism in roe deer Capreolus capreolus. Parasite 32, 45. https://doi.org/10.1051/parasite/2025041.
All Tables
Prevalence (% presence) and intensity of: GI strongyles (egg/g of feces), Trichuris sp. (egg/g of feces), Eimeria spp. (oocyst/g of feces), protostrongylids (larvae/g of feces) according to the sector of Chizé as well as the total at the site.
Performance of linear and generalized linear mixed models (sector and null models) to explain the variation in the prevalence and intensity of each group of parasites according to different predictors in fixed effect (age, sex, body mass, Julian date and sector) and in random effect (year of capture and individual identity). The best model (in bold) is the model reflecting the best compromise between accuracy and complexity of the model. ΔAICc is the difference in AICc between the two models.
Best model set descriptions and extracted values for the prevalence of each parasite species. In bold: significant effect (p-value < 0.05) of the predictor in each model.
Best model set descriptions and extracted values for the intensity of each parasite species. In bold: significant effect (p-value < 0.05) of the predictor in each model.
All Figures
|
Figure 1 Maps of the study site of Chizé stratified into two habitats with its location in France. On the left: the two sectors characterized as richer (R) and poorer (P). This figure was carried out using Qgis 3.16 software. |
| In the text | |
|
Figure S1: Number of observations according the age of roe deer and the sector. Black, sector R; light grey, sector P. |
| In the text | |
|
Figure S3: Presence/absence of a) Gastrointestinal strongyles, b) Trichuris sp., c) Eimeria spp. and d) Protostrongylids in roe deer according to the age of individuals. Black, absence of parasites; Light grey, presence of parasites. |
| In the text | |
Current usage metrics show cumulative count of Article Views (full-text article views including HTML views, PDF and ePub downloads, according to the available data) and Abstracts Views on Vision4Press platform.
Data correspond to usage on the plateform after 2015. The current usage metrics is available 48-96 hours after online publication and is updated daily on week days.
Initial download of the metrics may take a while.