Open Access
Figure 1
Download original image
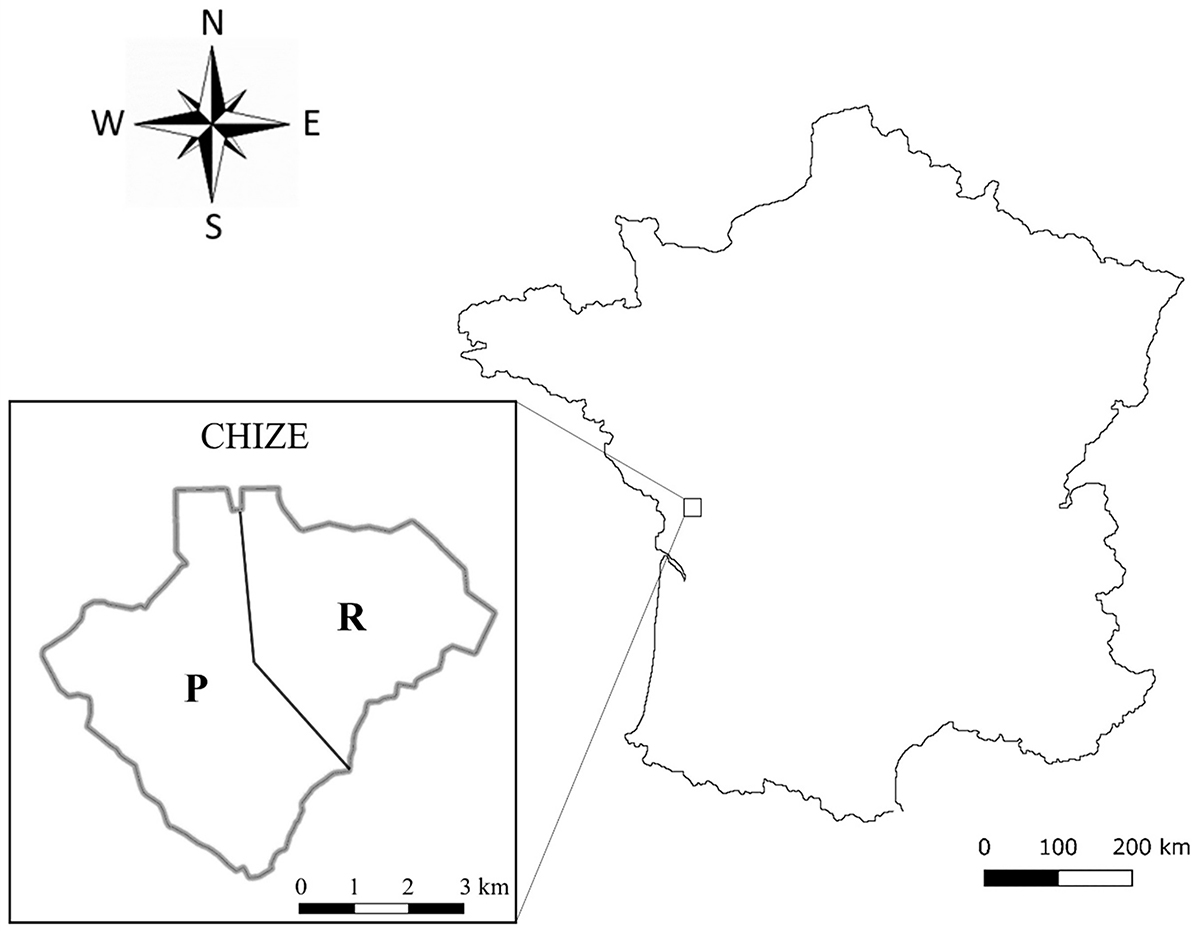
Maps of the study site of Chizé stratified into two habitats with its location in France. On the left: the two sectors characterized as richer (R) and poorer (P). This figure was carried out using Qgis 3.16 software.
Current usage metrics show cumulative count of Article Views (full-text article views including HTML views, PDF and ePub downloads, according to the available data) and Abstracts Views on Vision4Press platform.
Data correspond to usage on the plateform after 2015. The current usage metrics is available 48-96 hours after online publication and is updated daily on week days.
Initial download of the metrics may take a while.