| Issue |
Parasite
Volume 32, 2025
|
|
|---|---|---|
| Article Number | 38 | |
| Number of page(s) | 10 | |
| DOI | https://doi.org/10.1051/parasite/2025031 | |
| Published online | 24 June 2025 | |
Research Article
Genetic diversity and structure of Oncomelania hupensis snails in an area where Schistosoma japonicum transmission has been interrupted for nearly 30 years
Diversité et structure génétique des mollusques Oncomelania hupensis dans une zone où la transmission de Schistosoma japonicum est interrompue depuis près de 30 ans
1
Department of Epidemiology and Statistics, School of Public Health, Jiangsu Key Laboratory of Preventive and Translational Medicine for Geriatric Diseases, MOE Key Laboratory of Geriatric Diseases and Immunology, Suzhou Medical College of Soochow University, Suzhou, Jiangsu 215123, P.R. China
2
Community Health Service Center of Nicheng, Pudong New Area District, Shanghai 201306, P.R. China
* Corresponding author: This email address is being protected from spambots. You need JavaScript enabled to view it.
Received:
20
January
2025
Accepted:
26
May
2025
Abstract
China was once a major endemic zone for Schistosoma japonicum, but decades of control efforts have dramatically reduced transmission. Suzhou City, in Jiangsu Province, a former hyperendemic area, achieved transmission interruption in 1995. However, the intermediate host Oncomelania hupensis persists and new habitats in non-endemic villages pose resurgence risks if parasites are reintroduced. To evaluate genetic resilience and dispersal potential, we analyzed six O. hupensis populations (214 snails) from ecologically distinct habitats in Wuzhong district, Suzhou (2018 to 2021): Guangfu (GF20 and GF21: wetlands), Jinting (JT18, JT19, and JT20: isolated island), and Dongshan (DS19: lakeside hills). Using nine microsatellite loci, we identified 91 alleles and assessed genetic diversity, structure, and demography. All populations exhibited low observed heterozygosity (Ho < 0.5), with bottlenecks detected in GF21, GF20, and JT20. Paradoxically, infinite effective population sizes (Ne) at 95% CI upper limits suggested retained adaptive potential. Significant genetic differentiation (FST = 0.287, p < 0.01) reflected habitat-driven isolation: Jinting’s island populations diverged markedly from Dongshan and Guangfu, while bidirectional gene flow (Nm > 1) between Guangfu’s temporally sampled populations indicated sustained genetic connectivity over time. DIYABC modeling traced JT20’s ancestry to admixture between Jinting (JT18) and Guangfu (GF20) sources, implicating flood-mediated dispersal. Despite local control efficacy, snails retain resilience via large Ne. These findings mandate habitat-tailored strategies: habitat modification and intensified molluscicide campaigns in Guangfu and targeted eradication of Jinting’s isolated populations. Integrating genetic surveillance into snail monitoring programs will be critical to sustaining transmission interruption and achieving elimination in ecologically complex regions.
Résumé
La Chine était autrefois une zone d’endémie majeure pour Schistosoma japonicum, mais des décennies de lutte ont permis de réduire considérablement la transmission. La ville de Suzhou, dans la province du Jiangsu, ancienne zone hyperendémique, a réussi à interrompre la transmission en 1995. Cependant, l’hôte intermédiaire Oncomelania hupensis persiste et la création de nouveaux habitats dans des villages non endémiques présente un risque de résurgence en cas de réintroduction du parasite. Afin d’évaluer la résilience génétique et le potentiel de dispersion, nous avons analysé six populations d’O. hupensis (214 mollusques) provenant d’habitats écologiquement distincts dans le district de Wuzhong, à Suzhou (2018 à 2021) : Guangfu (GF20 et GF21 : zones humides), Jinting (JT18, JT19 et JT20 : île isolée) et Dongshan (DS19 : collines au bord du lac). À l’aide de neuf loci microsatellites, nous avons identifié 91 allèles et évalué la diversité génétique, la structure et la démographie. Toutes les populations présentaient une faible hétérozygotie observée (Ho < 0,5), avec des goulots d’étranglement détectés dans GF21, GF20 et JT20. Paradoxalement, des tailles de population effectives infinies (Ne) aux limites supérieures de l’IC à 95 % suggéraient un potentiel adaptatif conservé. Une différenciation génétique significative (FST = 0,287, P < 0,01) reflétait un isolement lié à l’habitat : les populations insulaires de Jinting divergeaient nettement de Dongshan et de Guangfu, tandis qu’un flux génétique bidirectionnel (Nm > 1) entre les populations échantillonnées temporellement de Guangfu indiquait une connectivité génétique soutenue au fil du temps. La modélisation DIYABC a retracé l’ascendance de JT20 jusqu’au mélange entre les sources de Jinting (JT18) et de Guangfu (GF20), impliquant une dispersion médiée par les inondations. Malgré l’efficacité du contrôle local, les mollusques conservent leur résilience grâce à un Ne important. Ces résultats nécessitent des stratégies adaptées à l’habitat : modification de l’habitat, intensification des campagnes de lutte antimolluscicide à Guangfu et éradication ciblée des populations isolées de Jinting. L’intégration de la surveillance génétique aux programmes de surveillance des mollusques sera essentielle pour maintenir l’interruption de la transmission et parvenir à l’élimination dans les régions écologiquement complexes.
Key words: Oncomelania hupensis / Population genetic analyses / Microsatellites / Snail monitoring
Edited by Jean-Lou Justine
Ze-Ting Liu and Han-Qi Peng contributed equally to this work.
© Z.-T. Liu et al., published by EDP Sciences, 2025
 This is an Open Access article distributed under the terms of the Creative Commons Attribution License (https://creativecommons.org/licenses/by/4.0), which permits unrestricted use, distribution, and reproduction in any medium, provided the original work is properly cited.
Introduction
Schistosomiasis is an infectious disease with a tremendous impact on human health and the social economy, affecting nearly 240 million people worldwide and putting more than 700 million people at risk of infection [6]. Among several schistosome species infecting humans, Schistosoma japonicum is considered the most virulent due to its higher egg production, as S. japonicum females produce significantly more eggs daily (~5,000) than other species (e.g., S. mansoni: ~200) triggering granulomatous inflammation, fibrosis, and organ damage [4, 23]. Moreover, the zoonotic nature of S. japonicum greatly complicates transmission dynamics and control efforts [26]. For example, in the Philippines because water buffalo, cattle, dogs, and a range of feral animals all contribute significantly to disease transmission, there is a need for innovative strategies to control schistosomiasis in the long term [28]. China was once severely affected by S. japonicum, with 11.8 million infections reported in the 1950s [39]. Over 70 years of sustained control efforts have achieved significant progress, reducing reported cases to 19,723 advanced schistosomiasis (the severe, late-stage complications) and three chronic infections in China in 2022 [45]. However, the goal of nationwide elimination by 2030 remains challenged by the persistence of the parasite’s sole intermediate host, Oncomelania hupensis [10].
Oncomelania hupensis, a freshwater amphibious snail, inhabits slow-moving water bodies, irrigation channels, and marshlands with dense vegetation. Its distribution is tightly linked to specific ecological conditions, including humidity, temperature, and soil composition [48]. The snail’s limited dispersal capacity restricts gene flow between isolated populations, promoting genetic differentiation; however, passive dispersal via water currents, flooding, or human activity (e.g., agricultural or water projects) can facilitate long-distance migration, particularly in connected habitats [5]. Oncomelania hupensis reproduces oviparously, depositing egg masses in moist substrates, with its lifetime (1–1.5 years) and population density highly sensitive to environmental disturbances such as molluscicide application or habitat modification [48]. China’s schistosomiasis control program has historically prioritized snail control and elimination through habitat modification, molluscicide application, and environmental management to disrupt O. hupensis breeding and reproduction [5, 34]. These strategies aim to directly suppress snail populations by fragmenting habitats and reducing hydrological connectivity, which drives genetic bottlenecks and differentiation [34]. For example, levee construction along the Yangtze River has reduced flooding frequency, isolating snail populations and eroding diversity in formerly connected wetlands [5]. The biological traits of O. hupensis shape expectations for its genetic structure: isolated populations may exhibit low diversity due to drift and inbreeding, while hydrologically connected habitats could sustain gene flow and resilience [20], and the capacity of O. hupensis populations to recover from demographic bottlenecks or environmental disturbances, while retaining genetic diversity and adaptive potential.
In China, S. japonicum transmission is now largely confined to regions south of the Yangtze River. Suzhou city, Jiangsu province, a former hyperendemic area on the lower reaches of the river, achieved transmission interruption in 1995 through integrated control measures [22]. Despite this success, O. hupensis persists in Suzhou, with new habitats recently detected in non-endemic villages of Wuzhong district [47]. This resurgence raises concerns, as genetic studies indicate shared mtDNA-based haplotypes between Suzhou snails and populations in S. japonicum-endemic regions like Shitai of Anhui [44], where wild rodents serve as main reservoirs [18, 24] and infected snails have been constantly reported [43]. Reintroduction of the parasite, through infected migratory workers or tourists from domestic areas or abroad [37], could reestablish transmission, as reported in Corsica where imported schistosomes caused an unexpected outbreak of urogenital schistosomiasis with more than 120 local people or tourists infected [2, 3]. This necessitates vigilant monitoring of snail population dynamics.
To evaluate the genetic resilience and dispersal potential of O. hupensis, we sampled six populations from three towns in Wuzhong District, Suzhou, from 2018 to 2021. Sampling targeted ecologically distinct habitats: (1) Jinting (JT): an island in Taihu Lake, isolated by up to 10 km of open water from mainland sites, with historical snail persistence despite intensive control; (2) Guangfu (GF): a wetland region interconnected by canals and seasonal floods, enabling passive snail dispersal; and (3) Dongshan (DS): a lakeside hilly area adjacent to Jinting. Temporal sampling (2018–2021) in Jinting (JT18, JT19, JT20) and Guangfu (GF20, GF21) allowed assessment of genetic stability under sustained control pressure. Using nine microsatellite loci [33], we analyzed genetic diversity, structure, and demographic history to address two questions: does habitat connectivity (e.g., GF’s wetlands vs. JT’s isolation) drive differences in genetic diversity and gene flow? Have prolonged control efforts eroded adaptive potential, or do populations retain resilience (as measured by genetic diversity, gene flow, and demographic stability) via migration or cryptic refugia? This study provides critical insights into how O. hupensis biology and landscape ecology interact to shape genetic patterns in a region post-schistosome transmission interruption, informing snail control strategies.
Materials and methods
Sampling snails
Six populations of O. hupensis snails were sampled between 2018 and 2021 from three ecologically distinct towns in Wuzhong District, Suzhou: Dongshan (DS19, 2019), Guangfu (GF20, 2020; GF21, 2021), and Jinting (JT18, 2018; JT19, 2019; JT20, 2020). Given the potential for local population turnover (e.g., molluscicide-driven extinctions or annual recolonization), each year’s sample was treated as an independent population to assess temporal genetic stability. All snails were confirmed to be non-infected with S. japonicum in the laboratory via cercarial shedding method [9], and only adults were preserved in ethanol for genotyping. Geographic coordinates of the targeted towns are detailed in Figure 1 and Table 1.
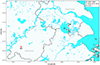 |
Figure 1 Geographical distribution of Oncomelania hupensis sampling in Wuzhong District, Suzhou, China. GF, JT, and DS for Guangfu, Jinting, and Dongshan, respectively. ST, for Shitai county of Anhui province, where S. japonicum transmission persists in wild animals. |
Geographical sampling details of Oncomelania hupensis populations across three towns (Dongshan, Guangfu, and Jinting) in Wuzhong District, Suzhou, China (2018–2021).
DNA extraction and microsatellite genotyping
A total of 30–45 snails were randomly selected from each snail population. Approximately 30 mg of muscle tissues from the pleopod was cut from each snail, and DNA was individually extracted using an EZgene™ Mollusc gDNA Kit (Biomiga, San Diego, CA, USA), following the manufacturer’s protocols.
PCR amplifications were conducted using a Multiplex PCR Plus Kit (QIAGEN, Hilden, Germany). Each snail was genotyped using nine previously characterized microsatellite loci (i.e., T6-17, DH02, B14, C22, DH01, T4-25, D11, T1-10, and T4-22) [16, 32, 46]. The forward primer for each pair was labeled with one of four fluorescent dyes (i.e., 6-FAM, HEX, TAMRA, or ROX), and two separate multiplex PCRs were employed with the first five loci in reaction one and the last four in reaction two [32]. Each PCR amplification was performed in 15 μL reactions, including 1.5 μL of snail DNA. The PCR amplification conditions were as follows: 95 °C for 5 min; 95 °C for 30 s, 60 °C for 60 s, 72 °C for 30 s, with 30 cycles; 65 °C for 30 min and 4 °C indefinitely. PCR amplification products were genotyped using an ABI3100 sequencer at Sangon Biotech (Shanghai, China).
Data analysis
Genetic diversities
The accurate lengths of amplified microsatellite DNA fragments were determined using GeneMarker HID V2.6 [19] and subsequently exported to an Excel table. To assess genetic diversity, GenAlex V6.5 [29] was used to calculate the number of observed alleles (Na), number of effective alleles (NeA), observed heterozygosity (Ho), expected heterozygosity (He), and inbreeding coefficient (FIS) per locus, as well as to test deviations from Hardy-Weinberg Equilibrium (HWE) for each locus.
Bottleneck effect and effective population size
BOTTLENECK V1.2 [30] was used to determine whether a snail population experienced a bottleneck effect or exhibited an expansion trend. Tests were performed under two different mutational models: the Infinite Allele Model (IAM) and the Two-Phase Model (TPM), the latter of which has been shown to be more suitable for microsatellite data [38]. As only nine loci were used, Wilcoxon’s sign-rank test was applied for statistical analysis. When a bottleneck effect occurs, the number of alleles decreases faster than heterozygotes over generations. Therefore, a bottleneck effect is indicated by the presence of excess heterozygosity, whereas a deficiency in heterozygosity may indicate recent population expansion [7].
To ensure robustness, NeEstimator [11] and LDNe [41] were used to estimate the effective population size (Ne) and its 95% confidence intervals (CIs) for each snail population. The linkage disequilibrium (LD) method was chosen for their calculation when the alleles had a frequency greater than or equal to 0.05. Ne refers to the number of parental individuals who effectively contribute to the next generation, with a larger Ne value indicating higher genetic diversity.
Population genetic structure
The Analysis of Molecular Variance (AMOVA) was conducted using Arlequin V3.5 [14] to partition the sources of genetic variation within and among snail populations. FST was calculated and its significance was tested at the significant level of 0.01 [42]. The following quantitative guidelines were used to interpret FST in terms of genetic differentiation: 0 to 0.05 (as little), 0.05 to 0.15 (moderate), 0.15 to 0.25 (great), and >0.25 (very great genetic differentiation) [35].
Bayesian clustering analysis was performed using STRUCTURE V2.3 [31]. Simulations were run with a 10,000 burn-in-period and 10,000 Markov Chain Monte Carlo (MCMC) iterations. The software was run with the number of clusters (K) ranging from two to ten, with 20 independent runs performed for each K value. The result files from STRUCTURE were visually analyzed using the online STRUCTURE HARVESTER [12], from which the estimation results including ln(K), delta K and the most likely number of clusters K [13] were finally estimated and outputted.
Principal Coordinate Analysis (PCoA) of genetic relatedness was performed using GenAlex V6.5 [29]. The genetic distances between snail individuals were calculated and used as input for PCoA analysis. Cluster analysis was conducted using the unweighted pair group method with arithmetic means (UPGMA), and the phylogenetic tree of six snail populations was constructed using MEGA X [21].
Genetic relationship between populations
The gene flow (Nm) between six snail populations was assessed using Migrate-N V5.0.4 [1]. The following parameters were used in the calculation: the Brownian motion model, the maximum likelihood method, three long chains set to 500,000, 10 short chains set to 10,000, a burn-in value set to 10,000, and a total of 3 million iterations. The temperatures (T) of the hot chains used to estimate likelihood approximations were 1.0, 1.5, 3.0, and 1,000,000. To minimize error, three independent repetitions of the operation were performed. Higher Nm values (>1) indicate sufficient genetic exchange to counteract genetic drift and maintain population connectivity, while lower values (<1) suggest limited gene flow and potential genetic differentiation [15].
Population divergence history
By using DIYABC V2.1.0 [8], the historical divergence and dynamics of snail populations were first analyzed based on linear discriminant analysis of summary statistics, and then the optimal model with the highest posterior probability was estimated with logistic regression. For each assumed scenario, we employed uniform priors for all parameters (Supplementary Table S1), simulated 106 datasets, calculated the posterior probability and its 95% CI, and selected the scenario with the highest posterior probability.
Results
Genetic diversity
Six populations comprising 214 O. hupensis snails were genotyped across nine microsatellite loci. The T4-22 locus was excluded due to excessive missing data from amplification failure, leaving eight loci for analysis. A total of 91 alleles were identified, with an average of 11.375 alleles per locus. Allelic diversity ranged from seven alleles at locus T6-17 to 23 alleles at locus T4-25, reflecting variability across markers.
Genetic diversity metrics across the six O. hupensis populations revealed marked variability (Table 2). The number of observed alleles per locus (Na) ranged from 2.625 (JT19) to 6.375 (GF21), while effective alleles (NeA) varied between 1.945 (JT19) and 3.993 (GF20). Guangfu populations exhibited the highest diversity, with GF20 showing the greatest expected heterozygosity (He = 0.740; unbiased He = 0.758) and GF21 displaying the highest observed heterozygosity (Ho = 0.477). In contrast, Jinting’s JT19 population had the lowest diversity (He = 0.356, Ho = 0.182). Inbreeding coefficients (FIS) ranged from 0.337 (GF21) to 0.596 (JT19), reflecting moderate-to-severe inbreeding. Deviations from Hardy-Weinberg Equilibrium (HWE) were widespread (64.58% of loci, p < 0.01), with JT19 departing from equilibrium at all loci.
Genetic diversity indices for six Oncomelania hupensis populations.
Population bottleneck tests and effective population size
Bottleneck analysis (Table 3) revealed no significant heterozygosity deficiency under either the Infinite Allele Model (IAM) or Two-Phase Model (TPM) (p > 0.05), indicating no evidence of recent population expansions. However, significant heterozygosity excess, a signature of demographic bottlenecks, was detected in six populations under IAM (p < 0.05), with three populations (GF21, GF20, JT20) also showing significance under TPM (p < 0.05). These results strongly suggest recent bottlenecks in Guangfu (GF21, GF20) and Jinting (JT20) populations.
Bottleneck test results for Oncomelania hupensis populations under the Infinite Allele Model (IAM) and Two-Phase Model (TPM).
The effective population size (Ne) and its 95% CIs estimated using NeEst and LDNe are shown in Table 4. Infinite Ne for most populations (e.g., GF21, JT19, JT18), reflecting retained genetic diversity and low drift. Negative Ne values (e.g., GF21: −33.0) are methodological artifacts, interpreted as infinite due to minimal drift signals [14]. Finite estimates (e.g., GF20: 64.7; DS19: 164.2) still show high upper bounds (Infinite), suggesting resilience.
Effective population size (Ne) estimates and 95% confidence intervals for Oncomelania hupensis populations using NeEst and LDNe linkage disequilibrium methods.
Population structure
The nested AMOVA results (Table 5) showed significant genetic differentiation both among towns (13.22%, FST = 0.2874) and among years within towns (18.06%, FSC = 0.2081). Pairwise FST values between snail populations (Table 6) ranged from 0.036 to 0.409 (all p < 0.01), with the lowest between GF20 and GF21 and the highest between DS19 and JT18.
Hierarchical Analysis of Molecular Variance (AMOVA) partitioning genetic variation among towns, years within towns, and within populations.
Pairwise FST values (lower triangle) and corresponding p-values (upper triangle) quantifying genetic differentiation among six Oncomelania hupensis populations.
Bayesian clustering analysis (STRUCTURE) revealed the genetic structure of the six O. hupensis populations (Fig. 2), with the optimal number of clusters determined as K = 2 based on the highest ΔK value (Fig. 2B). Principal Coordinate Analysis (PCoA) further supported spatial clustering, with individuals from each town forming distinct groups (Fig. 3). Notably, a subset of JT20 snails clustered with DS19, suggesting potential dispersal or admixture between Jinting’s island and Dongshan’s lakeside habitats. Phylogenetic analysis (UPGMA tree, Fig. 4) resolved populations into two primary clades: one comprising Jinting (JT18, JT19, JT20) and Dongshan (DS19), and the other containing Guangfu’s wetland populations (GF20, GF21). Within the first clade, JT20 and DS19 formed a subcluster, distinct from JT18 and JT19, reflecting finer-scale divergence.
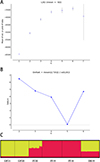 |
Figure 2 Bayesian clustering analysis (STRUCTURE) of Oncomelania hupensis populations, indicating optimal genetic clusters (K = 2). A: Mean (±SD) natural logarithm of the likelihood of the data [LnP(X | K)] for value of assumed clusters (K). B: Delta K value is plotted against the number of assumed K. C: Genetic structure with K = 2. Each individual is represented by a thin vertical line, which is partitioned into K colored segments that represents the individual’s estimated membership fractions in K clusters. Black lines separate individuals of different populations. The figure shown for a given K is based on the highest probability run at that K. Populations are labelled below the figure. |
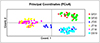 |
Figure 3 Principal Coordinate Analysis (PCoA) of genetic distances among six Oncomelania hupensis populations. |
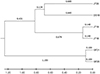 |
Figure 4 UPGMA phylogenetic tree illustrating genetic relationships among six Oncomelania hupensis populations. |
Populations genetic relationship and divergence history
The magnitude of gene flow calculated by Migrate-N is shown in Table 7. High gene flow (bidirectional migration, Nm = 1.24 to 2.32) was observed between GF21 and GF20. Minimal gene flow (Nm < 0.1) was observed for most other comparisons. GF21 and GF20 received the highest total migration (Nm = 1.25 to 2.34), while the other four populations were largely isolated (Nm = 0.09 to 0.27).
Gene flow (Nm) and scaled effective population size (θ) estimates between Oncomelania hupensis populations derived from Migrate-N analysis.
Given the highest gene flow observed between Guangfu populations GF21 and GF20, alongside the notably low genetic diversity in Jinting’s JT19 population, we excluded GF21 and JT19 to focus on historical divergence among four populations: JT18, DS19, JT20, and GF20. Using DIYABC V2.1.0, we modeled divergence dynamics of the four populations with JT18 (the earliest temporal population, sampled in 2018) as the ancestral population. We evaluated 33 possible historical scenarios (Supplementary Table S2), including admixture and non-admixture hypotheses, through one million simulations per scenario (Supplementary Table S3). Initial analysis identified five top-performing scenarios (3, 11, 24, 25, and 33) for further refinement. In subsequent rounds, Scenarios 11 and 24 exhibited comparable posterior probability, prompting a final evaluation. Ultimately, Scenario 11 (Supplementary Table S4) achieved the higher posterior probability (0.5594; 95% CI: 0.4551–0.6637), supporting a divergence pathway in which JT18 first split into DS19, followed by DS19 differentiating into GF20. JT20 emerged later via admixture between JT18 and GF20 populations (Fig. 5).
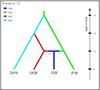 |
Figure 5 Historical divergence model (DIYABC) for four Oncomelania hupensis populations (GF20, DS19, JT20, and JT18), with posterior probabilities supporting admixture and split events. t3, t2, and t1 for divergence time point, and defined t3 > t2 and t2 > t1. |
Discussion
This study investigated the genetic diversity and population structure of six O. hupensis populations across three towns in Wuzhong district, Suzhou, China, sampled between 2018 and 2021. We observed markedly reduced genetic diversity in all populations, with observed heterozygosity (Ho) values consistently below 0.5. These values are significantly lower than those reported in other endemic regions, such as Anhui, Sichuan, and Yunnan provinces [36, 46]. The observed genetic bottlenecks, particularly in Guangfu (GF21, GF20) and Jinting (JT20), align with control efforts (e.g., annual molluscicide application) implemented in all sampled sites upon snail detection, a routine practice in Suzhou since achieving transmission interruption in 1995 [17]. These interventions likely fragmented populations, reducing gene flow and accelerating genetic drift.
Genetic variation analysis revealed higher diversity within populations than among them, with 64.58% of loci deviating from Hardy-Weinberg Equilibrium (HWE), likely due to inbreeding (FIS > 0.5 in Jinting populations) and sustained molluscicide pressure [26]. Guangfu populations (GF20, GF21) exhibited comparatively high genetic diversity (He ≈ 0.7) and bidirectional gene flow (Nm > 1), alongside infinite Ne estimates. These metrics collectively indicate retained adaptive potential, a capacity for rapid population recovery due to large Ne and sustained genetic connectivity over time, which necessitates intensified control efforts (e.g., increased molluscicide frequency, habitat disruption) to counteract resilience. Conversely, Jinting populations (JT18, JT19) showed low diversity (Ho < 0.3) and severe inbreeding (FIS > 0.5), likely due to geographic isolation and control-driven fragmentation. While inbreeding may elevate local extinction risks, it also increases the likelihood of drug resistance fixation in surviving snails, complicating eradication [25, 27].
Significant genetic differentiation (FST = 0.2874, p < 0.01) among populations reflects synergistic pressures from sustained control measures and landscape-mediated isolation. Jinting’s island populations (JT18, JT19, and JT20), situated ~10 km offshore in Taihu Lake, diverged markedly from lakeside Dongshan (DS19) and wetland Guangfu (GF20 and GF21). This divergence aligns with isolation-by-environment principles [40], where distinct habitats (hilly vs. wetland) limit dispersal and adaptive gene flow. Guangfu’s wetland facilitated high gene flow between temporally sampled populations (GF20/GF21: Nm > 1), while Jinting’s geographic isolation amplified drift, compounded by temporal shift resulted from annual molluscicide applications. These patterns highlight how habitat heterogeneity and control intensity interact to shape genetic structure.
Notably, JT20 individuals exhibited mixed ancestry, clustering partially with DS19, despite Jinting’s isolation. DIYABC modeling supports JT20’s origin as an admixed population derived from Jinting (JT18) and Guangfu (GF20) sources. We posit that seasonal flooding in Taihu Lake occasionally transports snails from Dongshan’s lakeside habitats to Jinting’s island, where survivors from prior control efforts (refugia) interbreed with migrants. Meanwhile, divergence modeling indicates DS19 diverged earlier from ancestral JT18, with GF20 later splitting from DS19, a chronology consistent with Jinting’s historical role as a persistent snail reservoir. These dynamics underscore the dual role of natural dispersal (e.g., flooding) and human activity (e.g., habitat modification) in redistributing snails, complicating elimination efforts in hydrologically dynamic regions.
While skewed sex ratios could theoretically reduce genetic diversity, the inferred infinite Ne and high FIS in Jinting populations likely reflect habitat fragmentation and control-induced bottlenecks rather than reproductive skew. Future studies should integrate sex ratio validation to refine genetic monitoring and demographic history resolution for O. hupensis populations.
Conclusion
This study revealed critical insights into the genetic resilience of O. hupensis in post-S. japonicum transmission interruption areas in Suzhou, China. Despite sustained control efforts, Guangfu’s wetland populations (GF20 and GF21) retained high genetic diversity and bidirectional gene flow, indicating sustained genetic connectivity over time; moreover, infinite Ne estimates suggest latent adaptive potential, necessitating intensified regional molluscicide campaigns. In contrast, Jinting’s isolated island populations (JT18, JT19, and JT20) exhibited low diversity and inbreeding, yet DIYABC modeling traced their origin to ancestral Jinting snails, highlighting risks of reseeding via flooding or human activity. We therefore recommend: (1) wetland-specific strategies: prioritize habitat modification and intensified molluscicide use in Guangfu; (2) targeted eradication: exploit Jinting’s isolation for focused elimination while monitoring flood-mediated dispersal; and (3) genetic surveillance: track Ne and FST trends to preempt resurgence. By aligning control efforts with landscape-driven genetic resilience, this work provides a roadmap for snail control and elimination in ecologically complex regions.
Acknowledgments
This work was supported by National Science Foundation of China to Da-Bing Lu [No. 81971957].
Conflicts of interest
The authors declare that they have no conflicts of interest.
Supplementary files
Table S1. Parameters and prior distributions used in DIYABC analysis.
Table S2. Demographic history scenarios assumed among four snail populations.
Table S3. Posterior probabilities of the assumed demographic history scenarios evaluated in DIYABC analysis.
Table S4. Posterior distributions of population demographic parameters from Scenario 11 with the highest posterior probability inferred in DIYABC analysis.
Access Supplementary MaterialReferences
- Beerli P, Felsenstein J. 2001. Maximum likelihood estimation of a migration matrix and effective population sizes in n subpopulations by using a coalescent approach. Proceedings of the National Academy of Sciences of the United States of America, 98(8), 4563–4568. [CrossRef] [PubMed] [Google Scholar]
- Boissier J, Grech-Angelini S, Webster BL, Allienne JF, Huyse T, Mas-Coma S, Toulza E, Barre-Cardi H, Rollinson D, Kincaid-Smith J, Oleaga A, Galinier R, Foata J, Rognon A, Berry A, Mouahid G, Henneron R, Mone H, Noel H, Mitta G. 2016. Outbreak of urogenital schistosomiasis in Corsica (France): an epidemiological case study. Lancet Infectious Diseases, 16(8), 971–979. [CrossRef] [Google Scholar]
- Boissier J, Mone H, Mitta G, Bargues MD, Molyneux D, Mas-Coma S. 2015. Schistosomiasis reaches Europe. Lancet Infectious Diseases, 15(7), 757–758. [CrossRef] [Google Scholar]
- Cheever AW, Macedonia JG, Mosimann JE, Cheever EA. 1994. Kinetics of egg production and egg excretion by Schistosoma mansoni and S. japonicum in mice infected with a single pair of worms. American Journal of Tropical Medicine and Hygiene, 50(3), 281–295. [CrossRef] [PubMed] [Google Scholar]
- Chen S, Li YL, Duan L, Liu JB, Zhou J, Lin DD, Zhang SQ, Yang K, Wen LY, Jin YJ, Xia S, Xu J, Lv S, Li SZ, Zhou XN. 2024. Assessment of the influence of levees along Yangtze River on Oncomelania hupensis, the intermediate host of Schistosoma japonicum. Parasites & Vectors, 17(1), 291. [CrossRef] [PubMed] [Google Scholar]
- Colley DG, Secor WE. 2014. Immunology of human schistosomiasis. Parasite Immunology, 36(8), 347–357. [CrossRef] [PubMed] [Google Scholar]
- Cornuet JM, Luikart G. 1996. Description and power analysis of two tests for detecting recent population bottlenecks from allele frequency data. Genetics, 144(4), 2001–2014. [CrossRef] [PubMed] [Google Scholar]
- Cornuet JM, Pudlo P, Veyssier J, Dehne-Garcia A, Gautier M, Leblois R, Marin JM, Estoup A. 2014. DIYABC v2.0: a software to make approximate Bayesian computation inferences about population history using single nucleotide polymorphism, DNA sequence and microsatellite data. Bioinformatics, 30(8), 1187–1189. [CrossRef] [PubMed] [Google Scholar]
- Dabo A, Diarra AZ, Machault V, Touré O, Niambélé DS, Kanté A, Ongoiba A, Doumbo O. 2015. Urban schistosomiasis and associated determinant factors among school children in Bamako, Mali, West Africa. Infectious Diseases of Poverty, 4, 4. [CrossRef] [PubMed] [Google Scholar]
- Ding H, Lu DB, Gao YM, Deng Y, Li Y. 2017. Genetic diversity and structure of Schistosoma japonicum within two marshland villages of Anhui, China, prior to schistosome transmission control and elimination. Parasitology Research, 116(2), 569–576. [CrossRef] [PubMed] [Google Scholar]
- Do C, Waples RS, Peel D, Macbeth GM, Tillett BJ, Ovenden JR. 2014. NeEstimator v2: re-implementation of software for the estimation of contemporary effective population size (Ne) from genetic data. Molecular Ecology Resources, 14(1), 209–214. [CrossRef] [PubMed] [Google Scholar]
- Earl DA, Vonholdt BM. 2012. STRUCTURE HARVESTER: a website and program for visualizing STRUCTURE output and implementing the Evanno method. Conservation Genetics Resources, 4(2), 359–361. [CrossRef] [Google Scholar]
- Evanno G, Regnaut S, Goudet J. 2005. Detecting the number of clusters of individuals using the software STRUCTURE: a simulation study. Molecular Ecology, 14(8), 2611–2620. [CrossRef] [PubMed] [Google Scholar]
- Excoffier L, Lischer HE. 2010. Arlequin suite ver 3.5: a new series of programs to perform population genetics analyses under Linux and Windows. Molecular Ecology Resources, 10(3), 564–567. [CrossRef] [PubMed] [Google Scholar]
- Fernando HSD, Hapugoda M, Perera R, Iv WCB, De Silva B. 2020. Gene flow patterns among Aedes aegypti (Diptera: Culicidae) populations in Sri Lanka. Insects, 11(3), 169. [CrossRef] [PubMed] [Google Scholar]
- Guan W, Li SZ, Abe EM, Webster BL, Rollinson D, Zhou XN. 2016. The genetic diversity and geographical separation study of Oncomelania hupensis populations in mainland China using microsatellite loci. Parasites & Vectors, 9, 28. [CrossRef] [PubMed] [Google Scholar]
- Gui GP, Cheng YH, Guo F, Hu YH, Lü DB, Shi WH. 2023. Monitoring and analysis of endemic situation of schistosomiasis in Suzhou New District from 2004 to 2021. Shanghai Journal of Preventive Medicine, 35(09), 857–862 [in Chinese]. [Google Scholar]
- He J, Chen X, Wang T, Gao F, Tao W, Dai B, Ding S, Liu T, LI Y, Wang H, Mao W, Zhang L, Xu X, Zhang S. 2022. Investigation on prevalence of Schistosoma japonicum infections in wild rodents in Shitai County, Anhui Province, 2018. Chinese Journal of Schistosomiasis Control, 34(6), 622–625 [in Chinese]. [Google Scholar]
- Holland MM, Parson W. 2011. GeneMarker® HID: A reliable software tool for the analysis of forensic STR data. Journal of Forensic Sciences, 56(1), 29–35. [CrossRef] [PubMed] [Google Scholar]
- Hu F, Ge J, Lv SB, Li YF, Li ZJ, Yuan M, Chen Z, Liu YM, Li YS, Ross AG, Lin DD. 2019. Distribution pattern of the snail intermediate host of schistosomiasis japonica in the Poyang Lake region of China. Infectious Diseases of Poverty, 8(1), 23. [CrossRef] [PubMed] [Google Scholar]
- Kumar S, Stecher G, Li M, Knyaz C, Tamura K. 2018. MEGA X: Molecular evolutionary genetics analysis across computing platforms. Molecular Biology and Evolution, 35(6), 1547–1549. [CrossRef] [PubMed] [Google Scholar]
- Liu BY, Cao Q, Gu BL, Rong GR, Cai G, Wu F, Zhu ZQ, Xu JD, Zhang JW, Jiang Z, Sun LP, Hong QB. 1995. Assessment on the elimination of schistosomiasis in four counties, cities, and districts of Jiangsu province. Chinese Journal of Schistosomiasis Control, 01, 57–58 [in Chinese]. [Google Scholar]
- Llanwarne F, Helmby H. 2021. Granuloma formation and tissue pathology in Schistosoma japonicum versus Schistosoma mansoni infections. Parasite Immunology, 43(2), e12778. [CrossRef] [PubMed] [Google Scholar]
- Lu DB, Wang TP, Rudge JW, Donnelly CA, Fang GR, Webster JP. 2010. Contrasting reservoirs for Schistosoma japonicum between marshland and hilly regions in Anhui, China – a two-year longitudinal parasitological survey. Parasitology, 137(1), 99–110. [CrossRef] [PubMed] [Google Scholar]
- Mendes C, Salgueiro P, Gonzalez V, Berzosa P, Benito A, do Rosário VE, de Sousa B, Cano J, Arez AP. 2013. Genetic diversity and signatures of selection of drug resistance in Plasmodium populations from both human and mosquito hosts in continental Equatorial Guinea. Malaria Journal, 12, 114. [CrossRef] [PubMed] [Google Scholar]
- Moendeg KJ, Angeles JMM, Nakao R, Leonardo LR, Fontanilla IKC, Goto Y, Kirinoki M, Villacorte EA, Rivera PT, Inoue N, Chigusa Y, Kawazu SI. 2017. Geographic strain differentiation of Schistosoma japonicum in the Philippines using microsatellite markers. PLoS Neglected Tropical Diseases, 11(7), e0005749. [CrossRef] [PubMed] [Google Scholar]
- Mohd Abd Razak MR, Sastu UR, Norahmad NA, Abdul-Karim A, Muhammad A, Muniandy PK, Jelip J, Rundi C, Imwong M, Mudin RN, Abdullah NR. 2016. Genetic diversity of Plasmodium falciparum populations in malaria declining areas of Sabah, East Malaysia. PLoS One, 11(3), e0152415. [CrossRef] [PubMed] [Google Scholar]
- Olveda DU, Li Y, Olveda RM, Lam AK, McManus DP, Chau TN, Harn DA, Williams GM, Gray DJ, Ross AG. 2014. Bilharzia in the Philippines: past, present, and future. International Journal of Infectious Diseases, 18, 52–56. [CrossRef] [Google Scholar]
- Peakall R, Smouse PE. 2012. GenAlEx 6.5: genetic analysis in Excel. Population genetic software for teaching and research – an update. Bioinformatics, 28(19), 2537–2539. [CrossRef] [PubMed] [Google Scholar]
- Piry S, Luikart G, Cornuet JM. 1999. BOTTLENECK: A computer program for detecting recent reductions in the effective population size using allele frequency data. Journal of Heredity, 90(4), 502–503. [CrossRef] [Google Scholar]
- Pritchard JK, Stephens M, Donnelly P. 2000. Inference of population structure using multilocus genotype data. Genetics, 155(2), 945–959. [CrossRef] [PubMed] [Google Scholar]
- Qiu C, Lu DB, Deng Y, Zou HY, Liang YS, Webster JP. 2019. Population genetics of Oncomelania hupensis snails, intermediate hosts of Schistosoma japonium, from emerging, re-emerging or established habitats within China. Acta Tropica, 197, 105048. [CrossRef] [PubMed] [Google Scholar]
- Qiu C, Zou HY, Deng Y, Liang YS, Lu DB. 2019. A meta-analysis of infection rates of Schistosoma japonicum in sentinel mice associated with infectious waters in mainland China over last 40 years. PLoS Neglected Tropical Diseases, 13(6), e0007475. [CrossRef] [PubMed] [Google Scholar]
- Shang J, Xu L, Zhong B, Wu Z, Chen L, Meng X, Wan J, Zhang Y, Pu C, Qian P, Li S, Liu Y. 2025. Genetic diversity and population structure of Oncomelania hupensis in Sichuan Province, China: implications for schistosomiasis control. International Journal for Parasitology, 55(5), 225–238. [CrossRef] [PubMed] [Google Scholar]
- Shrivastava J, Qian BZ, McVean G, Webster JP. 2005. An insight into the genetic variation of Schistosoma japonicum in mainland China using DNA microsatellite markers. Molecular Ecology, 14(3), 839–849. [CrossRef] [PubMed] [Google Scholar]
- Song J, Wang H, Li S, Du C, Qian P, Wang W, Shen M, Zhang Z, Zhou J, Zhang Y, Li C, Hao Y, Dong Y. 2024. The genetic diversity of Oncomelania hupensis robertsoni, intermediate hosts of Schistosoma japonicum in hilly regions of China, using microsatellite markers. Parasites & Vectors, 17(1), 147. [CrossRef] [PubMed] [Google Scholar]
- Song LG, Zeng XD, Li YX, Zhang BB, Wu XY, Yuan DJ, He A, Wu ZD. 2018. Imported parasitic diseases in mainland China: current status and perspectives for better control and prevention. Infectious Diseases of Poverty, 7(1), 78. [CrossRef] [PubMed] [Google Scholar]
- Spencer CC, Neigel JE, Leberg PL. 2000. Experimental evaluation of the usefulness of microsatellite DNA for detecting demographic bottlenecks. Molecular Ecology, 9(10), 1517–1528. [CrossRef] [PubMed] [Google Scholar]
- Sun LP, Wang W, Hong QB, Li SZ, Liang YS, Yang HT, Zhou XN. 2017. Approaches being used in the national schistosomiasis elimination programme in China: a review. Infectious Diseases of Poverty, 6(1), 55. [CrossRef] [PubMed] [Google Scholar]
- Wang IJ, Summers K. 2010. Genetic structure is correlated with phenotypic divergence rather than geographic isolation in the highly polymorphic strawberry poison-dart frog. Molecular Ecology, 19(3), 447–458. [CrossRef] [PubMed] [Google Scholar]
- Waples RS, Do C. 2008. ldne: a program for estimating effective population size from data on linkage disequilibrium. Molecular Ecology Resources, 8(4), 753–756. [CrossRef] [PubMed] [Google Scholar]
- Weir BS, Cockerham CC. 1984. Estimating F-statistics for the analysis of population structure. Evolution, 38(6), 1358–1370. [Google Scholar]
- Wu JL, Hu MC, Wang Q, Liu DH, Zhang LS, Zhu L, Sun CS, Cao ZG, Wang T-P. 2022. Comparison of pathogenicity and gene expression profiles between adult Schistosoma japonicum isolated from hilly and marshland and lake regions of Anhui Province. Chinese Journal of Schistosomiasis Control, 34(6), 580–587 [in Chinese]. [Google Scholar]
- Zhang JY, Gu MM, Yu QF, Sun MT, Zou HY, Zhou ZJ, Lu DB. 2022. Genetic diversity and structure of Oncomelania hupensis hupensis in two eco-epidemiological settings as revealed by the mitochondrial COX1 gene sequences. Molecular Biology Reports, 49(1), 511–518. [CrossRef] [PubMed] [Google Scholar]
- Zhang L, He J, Yang F, Dang H, Li Y, Guo S, Li S, Cao C, Xu J, Li S, Zhou X. 2023. Progress of schistosomiasis control in People’s Republic of China in 2022. Chinese Journal of Schistosomiasis Control, 35(3), 217–224 [in Chinese]. [Google Scholar]
- Zhang L, Li S, Wang Q, Qian Y, Liu Q, Yang P, Zhou X. 2012. Isolation and characterization of 15 new microsatellite markers in Oncomelania hupensis, the snail intermediate host of Schistosoma japonicum in mainland China. International Journal of Molecular Sciences, 13(5), 5844–5850. [CrossRef] [PubMed] [Google Scholar]
- Zhang LJ, Xu ZM, Guo JY, Dai SM, Dang H, Lü S, Xu J, Li SZ, Zhou XN. 2019. Endemic status of schistosomiasis in People’s Republic of China in 2018. Chinese Journal of Schistosomiasis Control, 31(6), 576–582 [in Chinese]. [Google Scholar]
- Zhou XN, Zhang Y, Hong QB, Xu JD, Wang TP. 2005. Science on Oncomelania Snail. Beijing, China: Science Press. [in Chinese]. [Google Scholar]
Cite this article as: Liu Z-T, Peng H-Q, Qi Y-X, Wu X-Y, Xu Q, Zhang H-X & Lu D-B. 2025. Genetic diversity and structure of Oncomelania hupensis snails in an area where Schistosoma japonicum transmission has been interrupted for nearly 30 years. Parasite 32, 38. https://doi.org/10.1051/parasite/2025031.
All Tables
Geographical sampling details of Oncomelania hupensis populations across three towns (Dongshan, Guangfu, and Jinting) in Wuzhong District, Suzhou, China (2018–2021).
Bottleneck test results for Oncomelania hupensis populations under the Infinite Allele Model (IAM) and Two-Phase Model (TPM).
Effective population size (Ne) estimates and 95% confidence intervals for Oncomelania hupensis populations using NeEst and LDNe linkage disequilibrium methods.
Hierarchical Analysis of Molecular Variance (AMOVA) partitioning genetic variation among towns, years within towns, and within populations.
Pairwise FST values (lower triangle) and corresponding p-values (upper triangle) quantifying genetic differentiation among six Oncomelania hupensis populations.
Gene flow (Nm) and scaled effective population size (θ) estimates between Oncomelania hupensis populations derived from Migrate-N analysis.
All Figures
|
Figure 1 Geographical distribution of Oncomelania hupensis sampling in Wuzhong District, Suzhou, China. GF, JT, and DS for Guangfu, Jinting, and Dongshan, respectively. ST, for Shitai county of Anhui province, where S. japonicum transmission persists in wild animals. |
| In the text | |
|
Figure 2 Bayesian clustering analysis (STRUCTURE) of Oncomelania hupensis populations, indicating optimal genetic clusters (K = 2). A: Mean (±SD) natural logarithm of the likelihood of the data [LnP(X | K)] for value of assumed clusters (K). B: Delta K value is plotted against the number of assumed K. C: Genetic structure with K = 2. Each individual is represented by a thin vertical line, which is partitioned into K colored segments that represents the individual’s estimated membership fractions in K clusters. Black lines separate individuals of different populations. The figure shown for a given K is based on the highest probability run at that K. Populations are labelled below the figure. |
| In the text | |
|
Figure 3 Principal Coordinate Analysis (PCoA) of genetic distances among six Oncomelania hupensis populations. |
| In the text | |
|
Figure 4 UPGMA phylogenetic tree illustrating genetic relationships among six Oncomelania hupensis populations. |
| In the text | |
|
Figure 5 Historical divergence model (DIYABC) for four Oncomelania hupensis populations (GF20, DS19, JT20, and JT18), with posterior probabilities supporting admixture and split events. t3, t2, and t1 for divergence time point, and defined t3 > t2 and t2 > t1. |
| In the text | |
Current usage metrics show cumulative count of Article Views (full-text article views including HTML views, PDF and ePub downloads, according to the available data) and Abstracts Views on Vision4Press platform.
Data correspond to usage on the plateform after 2015. The current usage metrics is available 48-96 hours after online publication and is updated daily on week days.
Initial download of the metrics may take a while.