Figure 2
Download original image
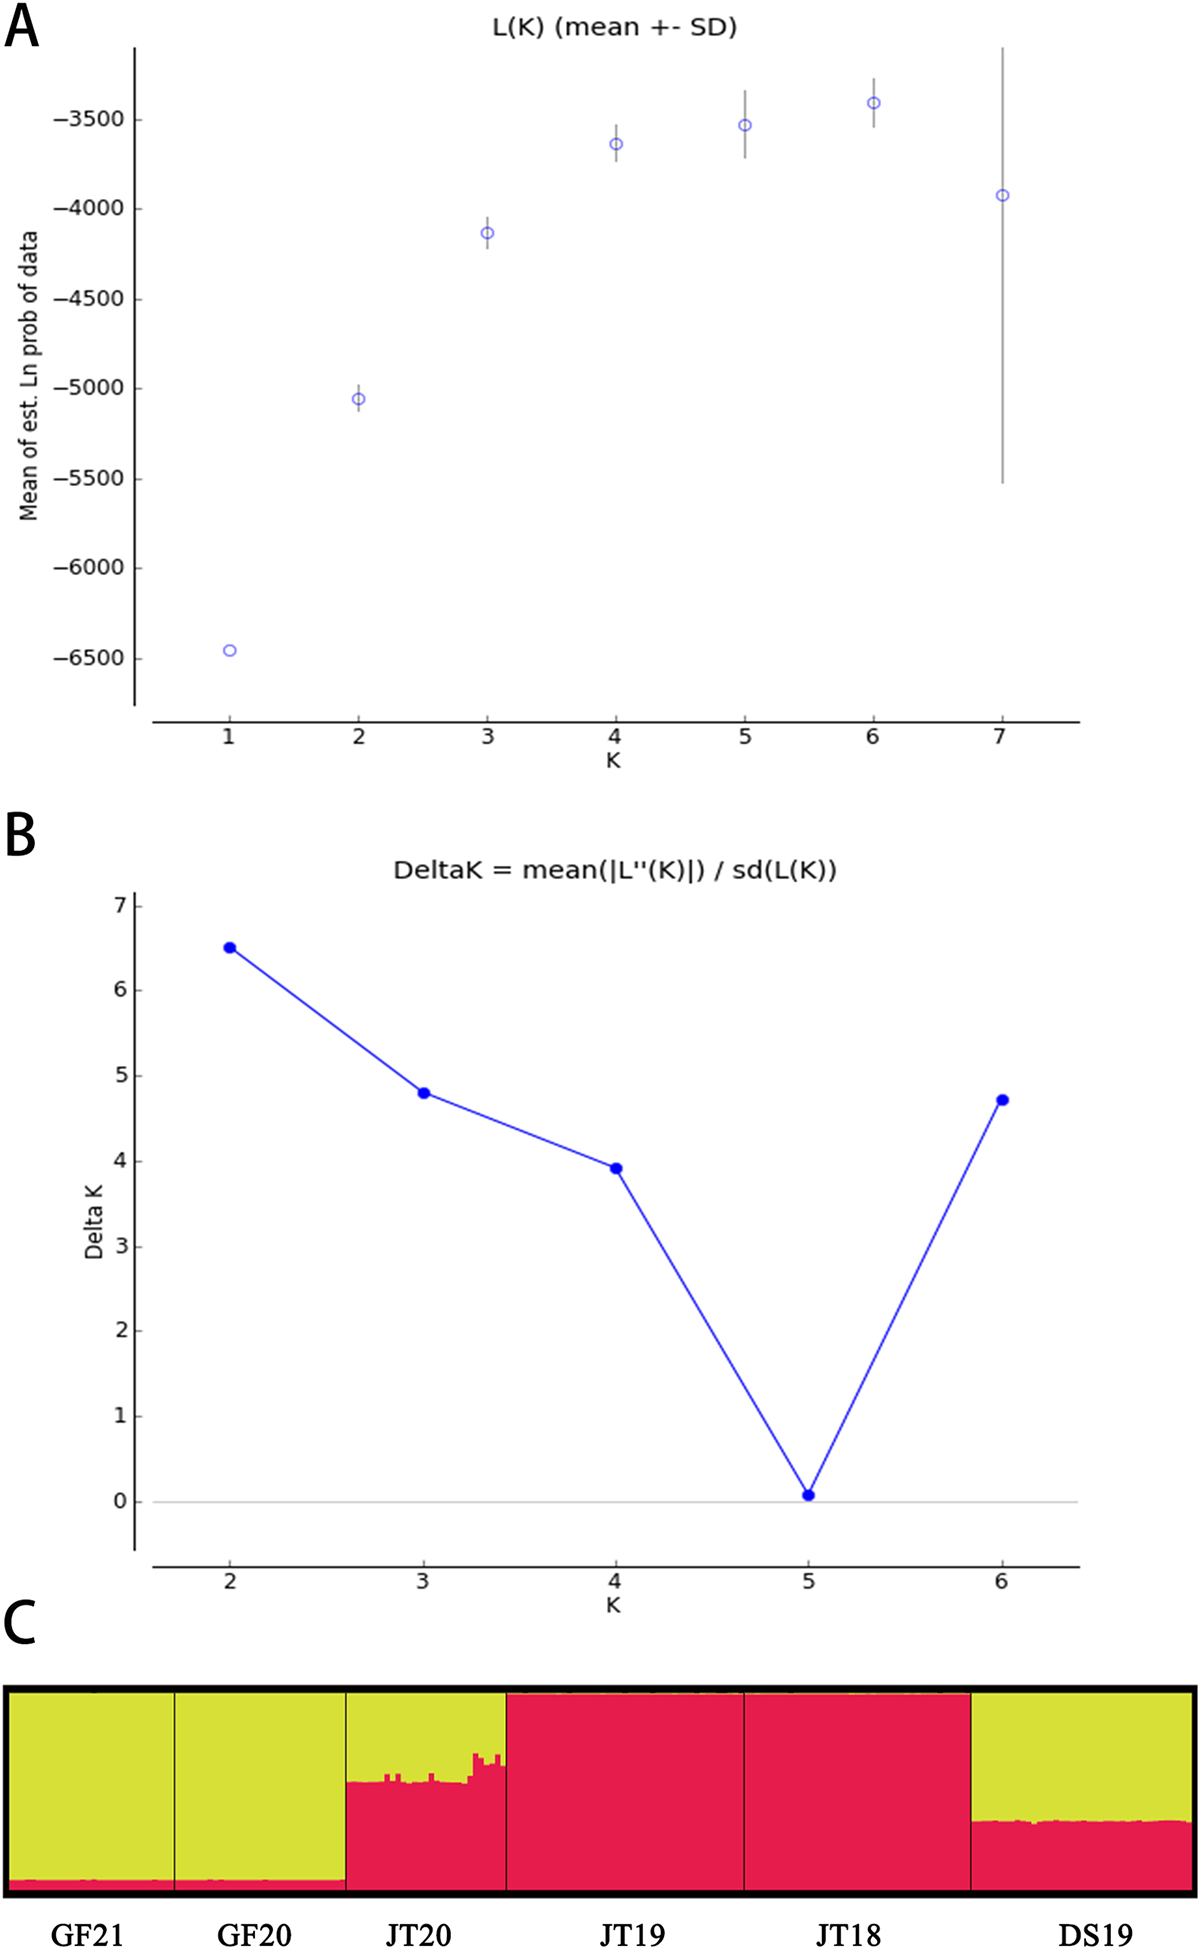
Bayesian clustering analysis (STRUCTURE) of Oncomelania hupensis populations, indicating optimal genetic clusters (K = 2). A: Mean (±SD) natural logarithm of the likelihood of the data [LnP(X | K)] for value of assumed clusters (K). B: Delta K value is plotted against the number of assumed K. C: Genetic structure with K = 2. Each individual is represented by a thin vertical line, which is partitioned into K colored segments that represents the individual’s estimated membership fractions in K clusters. Black lines separate individuals of different populations. The figure shown for a given K is based on the highest probability run at that K. Populations are labelled below the figure.
Current usage metrics show cumulative count of Article Views (full-text article views including HTML views, PDF and ePub downloads, according to the available data) and Abstracts Views on Vision4Press platform.
Data correspond to usage on the plateform after 2015. The current usage metrics is available 48-96 hours after online publication and is updated daily on week days.
Initial download of the metrics may take a while.