| Issue |
Parasite
Volume 33, 2026
|
|
|---|---|---|
| Article Number | 26 | |
| Number of page(s) | 15 | |
| DOI | https://doi.org/10.1051/parasite/2026025 | |
| Published online | 22 April 2026 | |
Supplementary materials
Table S1. Primers sequences designed for qRT-PCR. Download File(s)
|
Figure S1. Comparative analysis between ESP samples. (A) Venn diagram of protein sets identified in adult and plerocercoid. (B) Correlation analysis of six samples. (C) PCA analysis of six samples. |
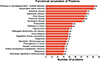 |
Figure S2. Statistical bar chart for pathway classification of ESPs in S. mansoni. |
|
Figure S3. Subcellular localization analysis of up-regulated proteins in adult and plerocercoid. |
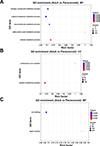 |
Figure S4. GO enrichment analysis of DEPs. |
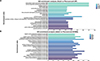 |
Figure S5. GO enrichment analysis of upregulated DEPs. |
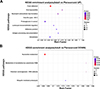 |
Figure S6. KEGG pathway enrichment entries of upregulated DEPs. |
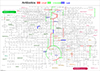 |
Figure S7. Map of the Ipath integration path diagram of biosynthesis of antibiotics. |
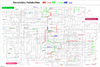 |
Figure S8. Map of the Ipath integration path diagram of biosynthesis of secondary metabolites. |
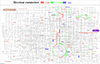 |
Figure S9. Map of the Ipath integration path diagram of microbial metabolism in diverse environments. |
© F. Gao et al., published by EDP Sciences, 2026
Current usage metrics show cumulative count of Article Views (full-text article views including HTML views, PDF and ePub downloads, according to the available data) and Abstracts Views on Vision4Press platform.
Data correspond to usage on the plateform after 2015. The current usage metrics is available 48-96 hours after online publication and is updated daily on week days.
Initial download of the metrics may take a while.