


Figure 3
Download original image
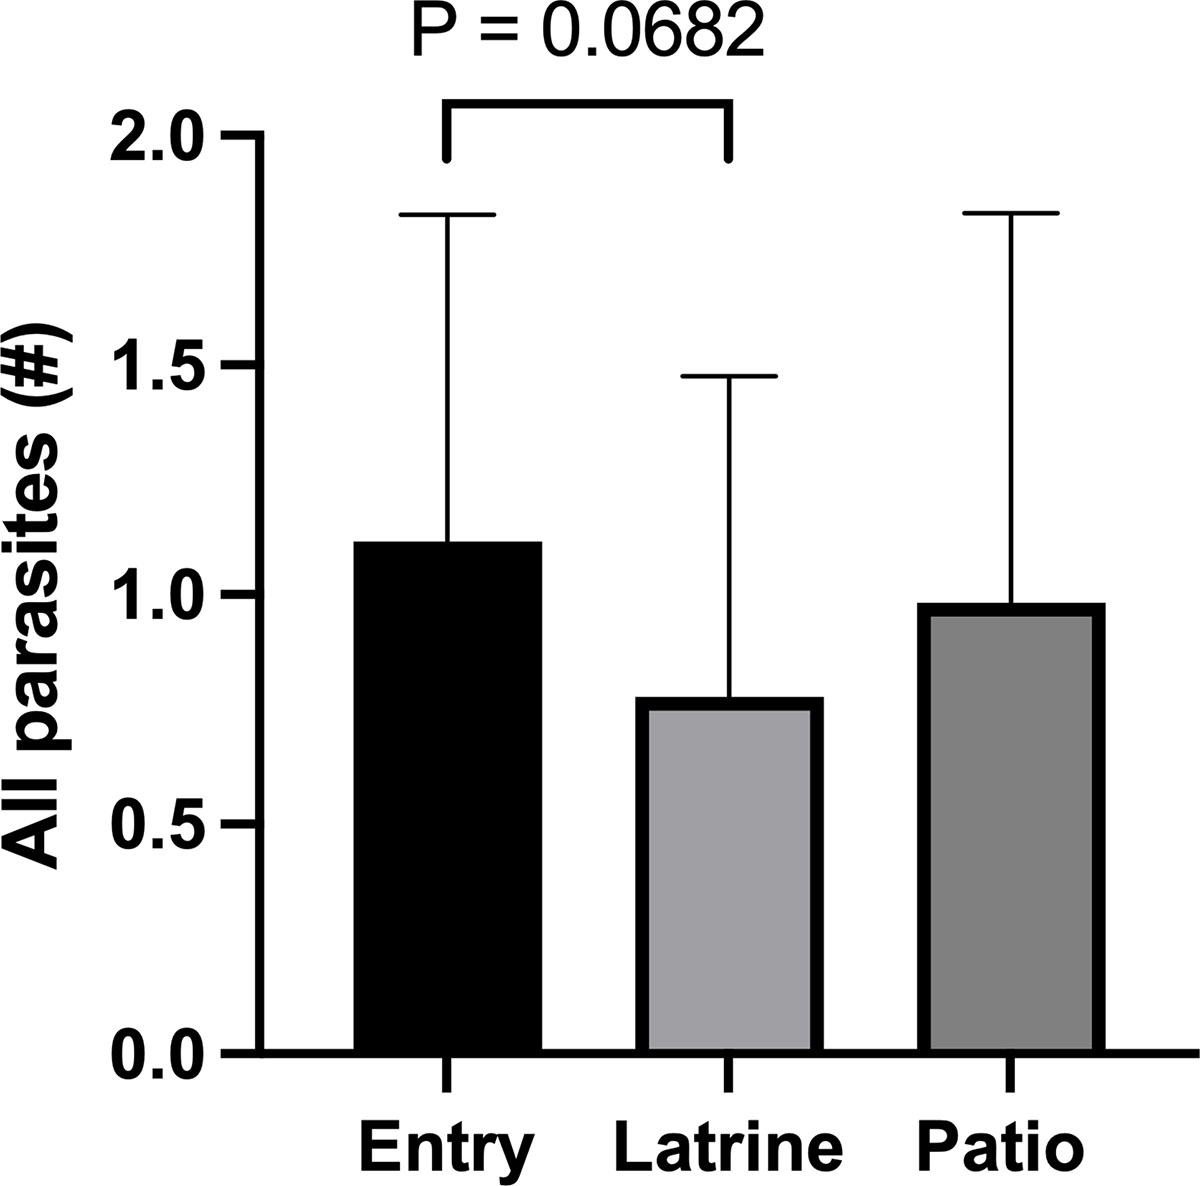
Comparative analysis of parasite species richness across household sampling zones. Mean number of different intestinal parasite species detected per outside-built environment sample. Bars represent the mean diversity observed at house entrances, latrine perimeters, and patio areas, with error bars indicating the standard deviation.
Current usage metrics show cumulative count of Article Views (full-text article views including HTML views, PDF and ePub downloads, according to the available data) and Abstracts Views on Vision4Press platform.
Data correspond to usage on the plateform after 2015. The current usage metrics is available 48-96 hours after online publication and is updated daily on week days.
Initial download of the metrics may take a while.