


Figure 1
Download original image
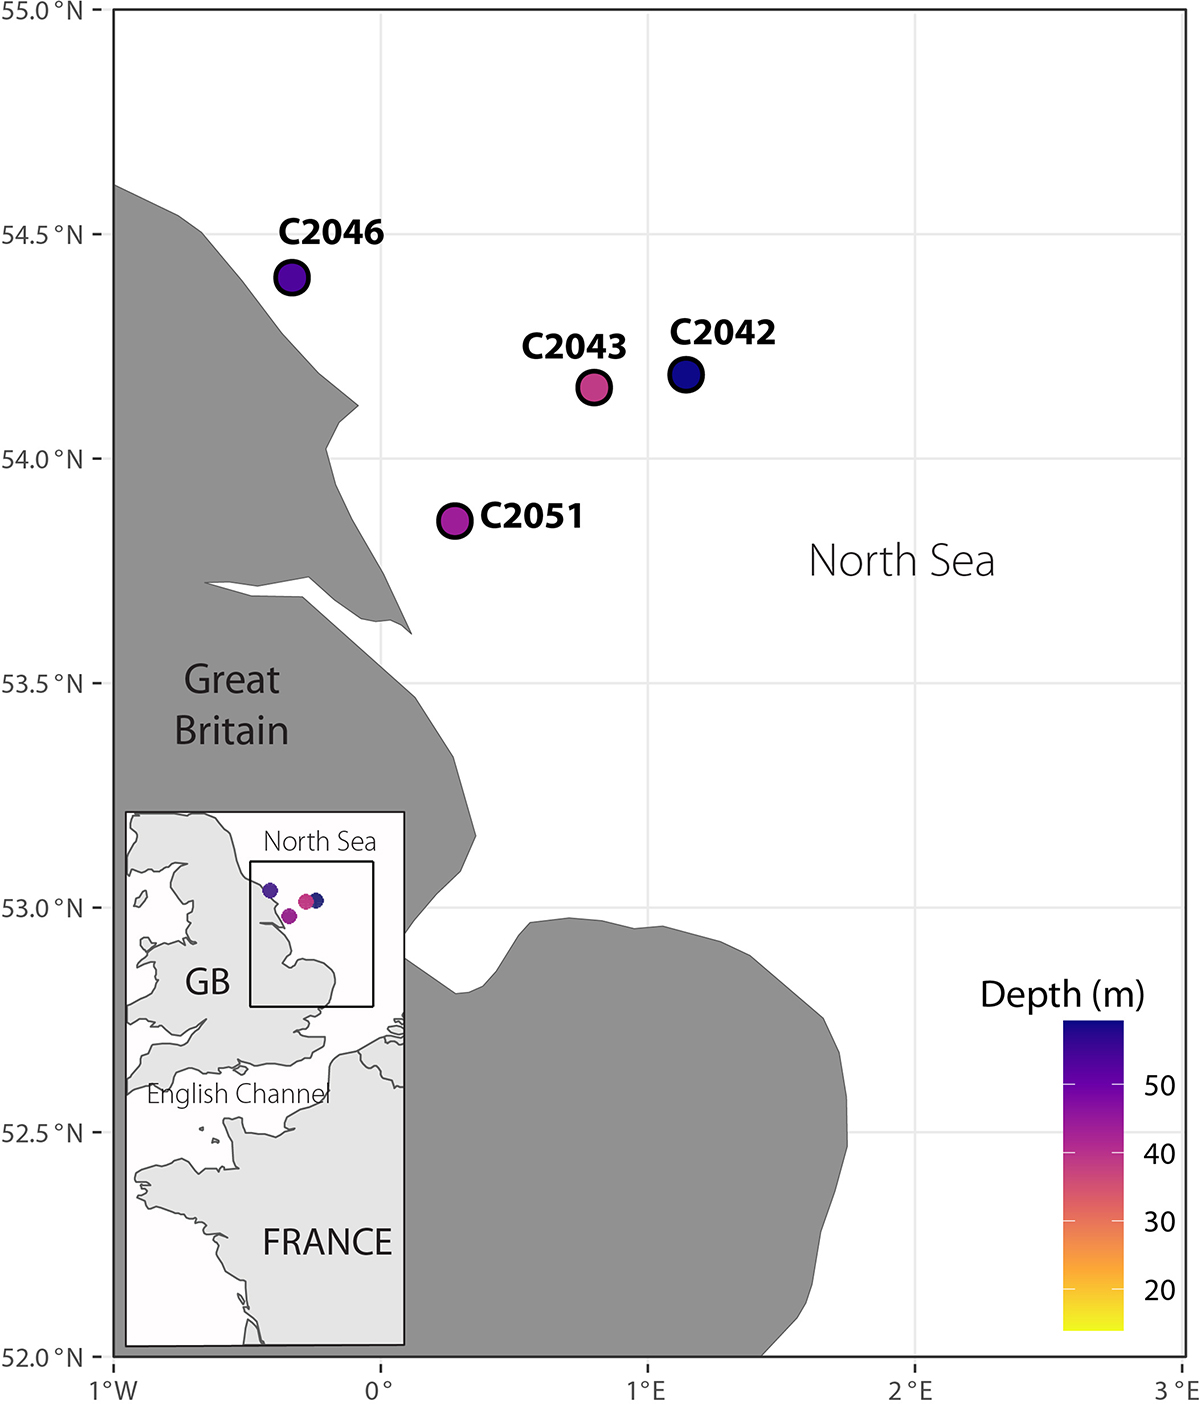
Map of stations sampled during the IBTS 2024 survey. The general location of sampling is presented in the bottom left inset, in which the rectangle highlights the more precise location of the sampling stations. Euphausiacea individuals from station C2043 (in italics) were used to calibrate the method, which was then applied to samples from the other three stations. Depth of the stations is illustrated by the colour of the dots.
Current usage metrics show cumulative count of Article Views (full-text article views including HTML views, PDF and ePub downloads, according to the available data) and Abstracts Views on Vision4Press platform.
Data correspond to usage on the plateform after 2015. The current usage metrics is available 48-96 hours after online publication and is updated daily on week days.
Initial download of the metrics may take a while.