Figure 1
Download original image
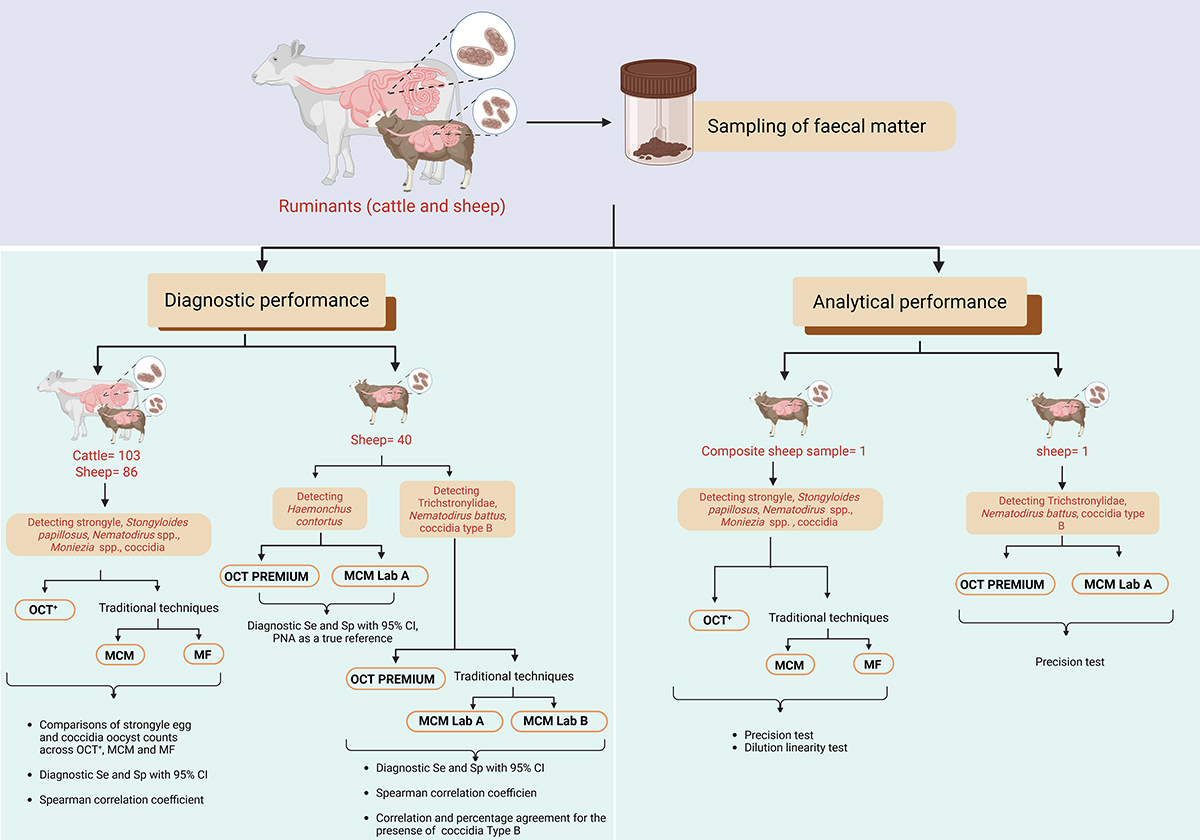
Schematic representation of the study, illustrating the workflow for diagnostic and analytical performance, where OCT+ refers to OvaCyte Plus, OCT Premium to OvaCyte Premium, MCM to McMaster technique, MF to Mini-FLOTAC, MCM Lab A to McMaster performed at laboratory A, MCM Lab B to McMaster performed at laboratory B, and PNA to peanut agglutinin fluorescence staining. Se indicates sensitivity and Sp indicates specificity, both with 95% confidence intervals (CI).
Current usage metrics show cumulative count of Article Views (full-text article views including HTML views, PDF and ePub downloads, according to the available data) and Abstracts Views on Vision4Press platform.
Data correspond to usage on the plateform after 2015. The current usage metrics is available 48-96 hours after online publication and is updated daily on week days.
Initial download of the metrics may take a while.