Figure 5
Download original image
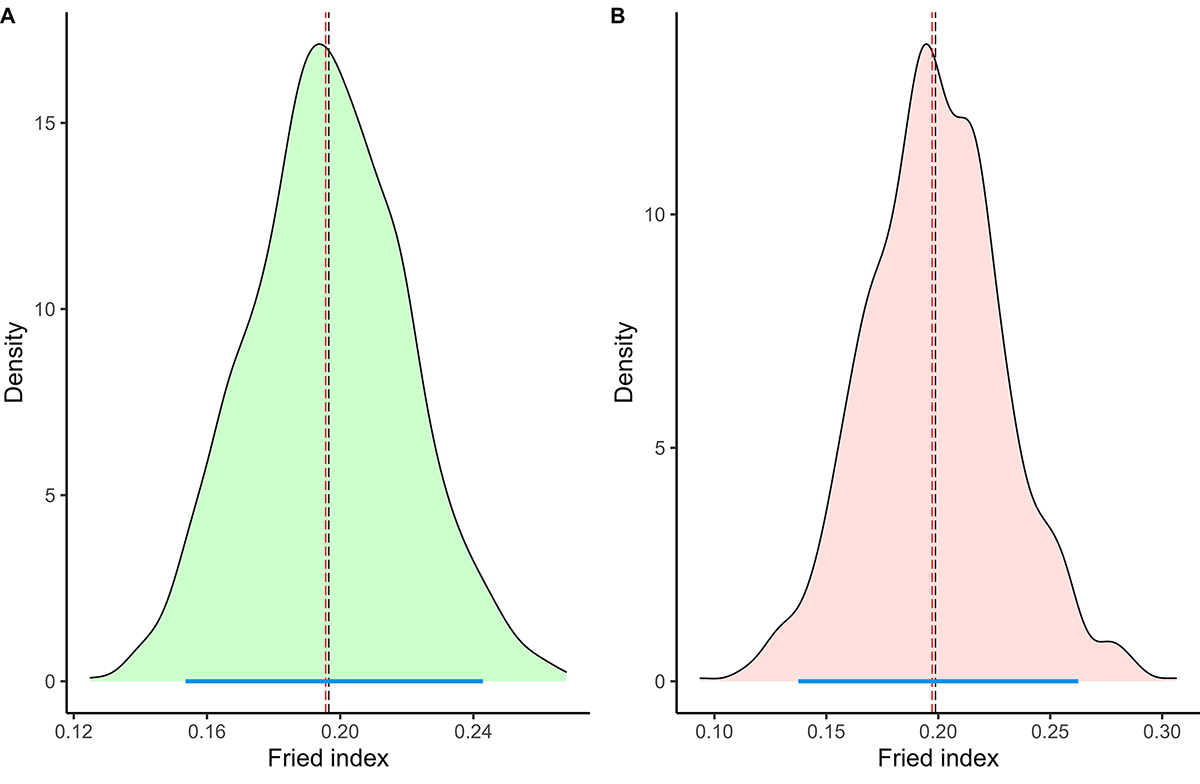
Bootstrap estimate of the Fried index. The long red dash indicates the estimate yield by the observed data, whereas the long black dash shows the bootstrap mean and 95% percentile interval in the blue line. (A) and (B) are intervention part 1 and 2 estimation of the Fried index from 1,000 bootstraps in the distributions of sterile-to-wild male ratios in the control and release areas, respectively. The density corresponds to the percentage of the simulations for a given value.
Current usage metrics show cumulative count of Article Views (full-text article views including HTML views, PDF and ePub downloads, according to the available data) and Abstracts Views on Vision4Press platform.
Data correspond to usage on the plateform after 2015. The current usage metrics is available 48-96 hours after online publication and is updated daily on week days.
Initial download of the metrics may take a while.