Figure 4
Download original image
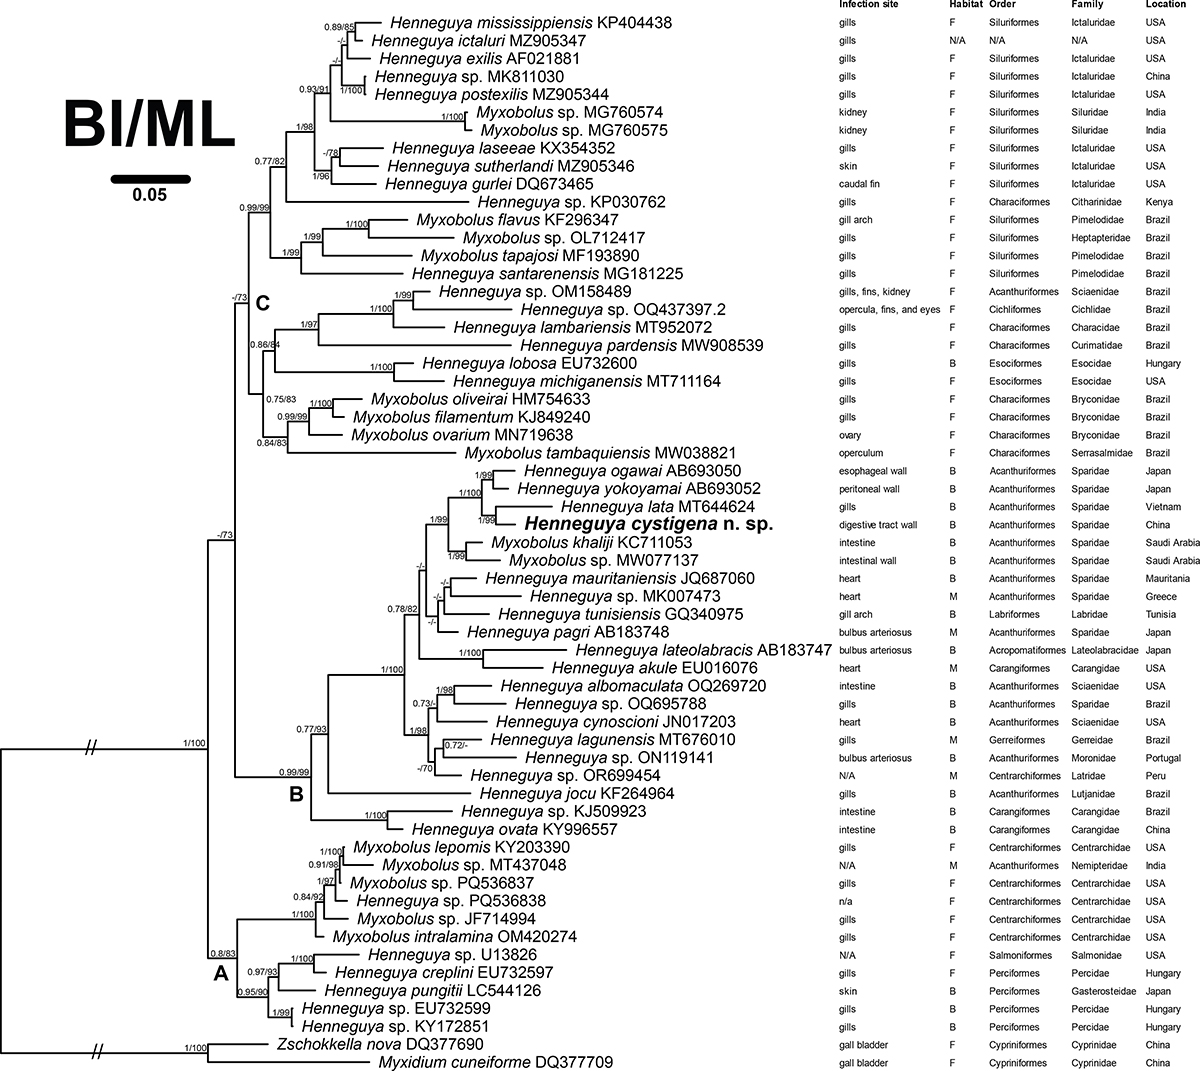
Phylogenetic tree reconstructed using Bayesian inference (BI) based on SSU rDNA sequences of Henneguya cystigena n. sp. and related myxosporeans. Bayesian posterior probability and maximum likelihood bootstrap values > 70 are indicated at each node. Dashes represent support values below 70. The species under study is highlighted in bold. For each organism, the following information is provided: GenBank accession number, infection site, habitat type (F: freshwatar; B: brackish water; M: marine; N/A: data not available), host affinity at order and family level, and host sampling location.
Current usage metrics show cumulative count of Article Views (full-text article views including HTML views, PDF and ePub downloads, according to the available data) and Abstracts Views on Vision4Press platform.
Data correspond to usage on the plateform after 2015. The current usage metrics is available 48-96 hours after online publication and is updated daily on week days.
Initial download of the metrics may take a while.