Figure 2
Download original image
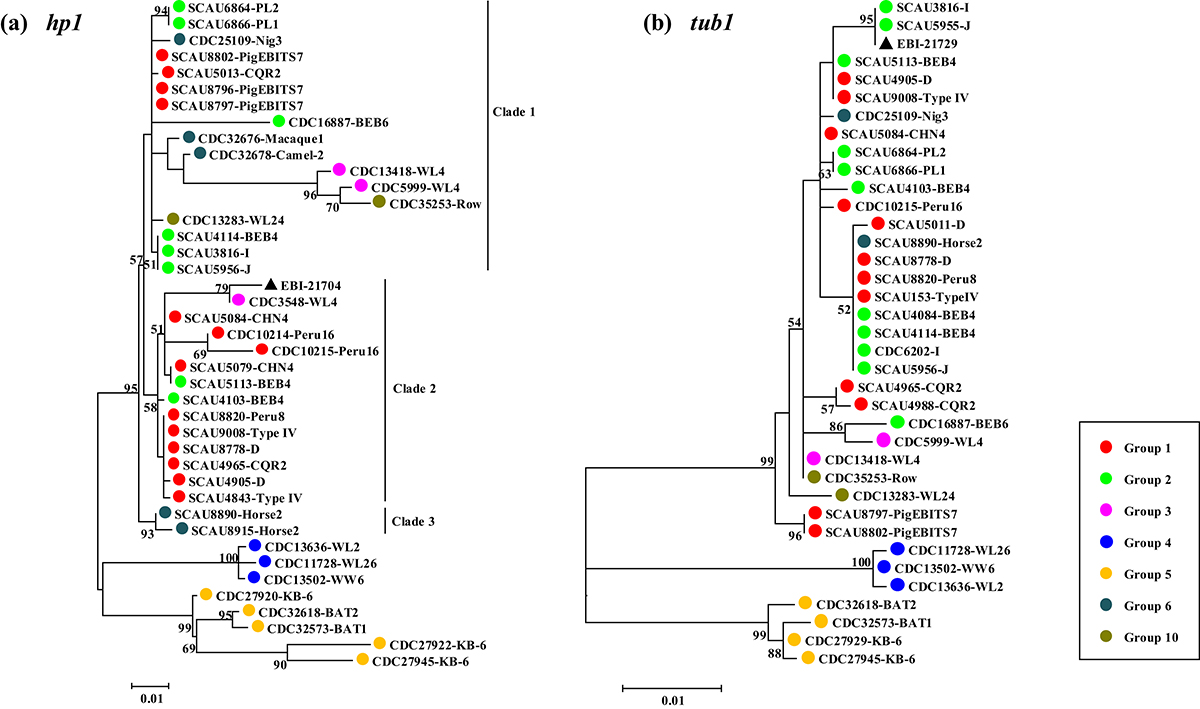
Maximum likelihood trees constructed using representative sequences of the hp1 (a) and tub1 (b) loci from Enterocytozoon bieneusi. Bootstrap values greater than 50% from 1000 replicates are shown on nodes. Circles of different colors (red, light green, magenta, blue, yellow, dark cyan, and olive) represent isolates from ITS Groups 1–6 and 10, respectively. The black triangle represents the reference sequence from GenBank.
Current usage metrics show cumulative count of Article Views (full-text article views including HTML views, PDF and ePub downloads, according to the available data) and Abstracts Views on Vision4Press platform.
Data correspond to usage on the plateform after 2015. The current usage metrics is available 48-96 hours after online publication and is updated daily on week days.
Initial download of the metrics may take a while.