Open Access
Figure 6
Download original image
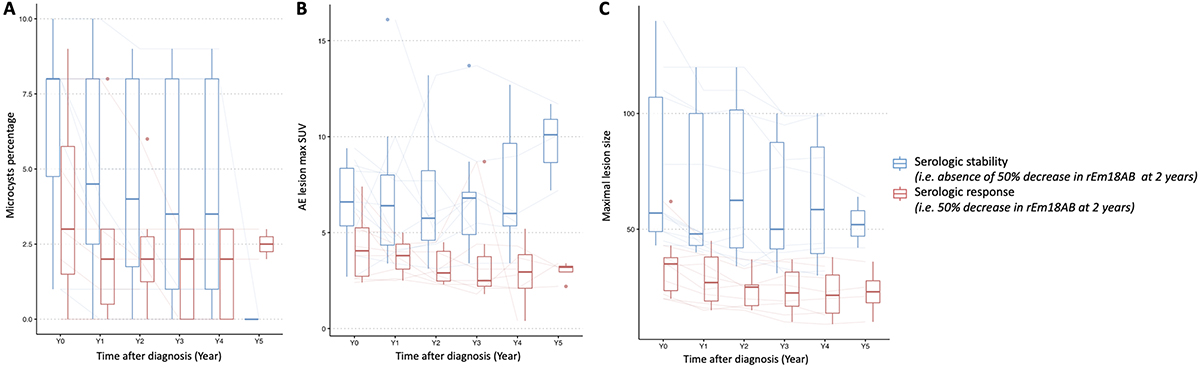
Box plot showing changes in the three main imaging features according to the serologic response. A. Change in percentage of microcysts according to the serologic response. B. Change in maximum lesion size according to the serologic response. C. Change in maximum lesion SUV according to the serologic response.
Current usage metrics show cumulative count of Article Views (full-text article views including HTML views, PDF and ePub downloads, according to the available data) and Abstracts Views on Vision4Press platform.
Data correspond to usage on the plateform after 2015. The current usage metrics is available 48-96 hours after online publication and is updated daily on week days.
Initial download of the metrics may take a while.