Figure 2
Download original image
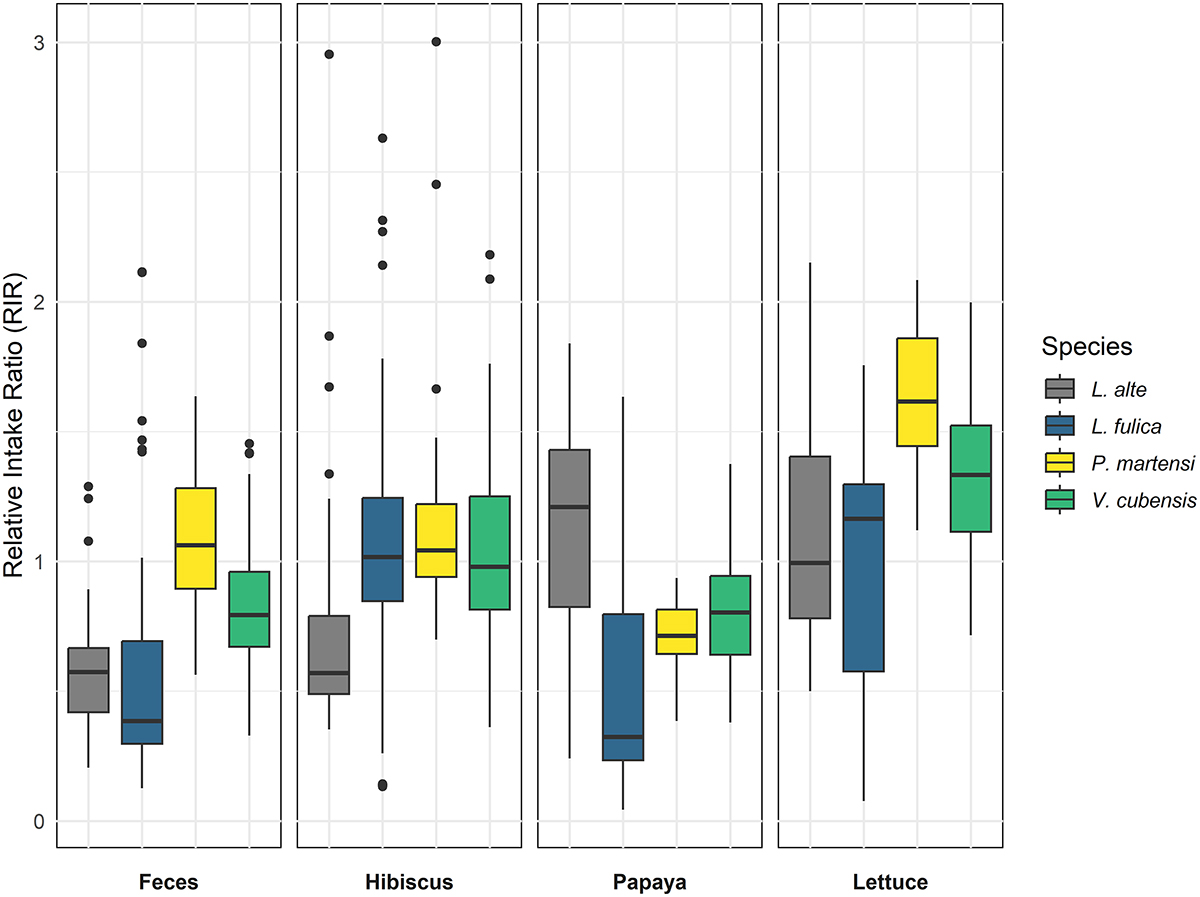
The relative intake ratio (RIR) (y-axis) represents food preference for each snail species (x-axis), for each food type. Boxplots represent data from 47 L. alte, 44 L. fulica, 46 P. martensi, and 47 V. cubensis. The box represents the interquartile range (IQR) with the median indicated by the central line. Whiskers extend 1.5 times the interquartile range, and data points outside this range are plotted as outliers.
Current usage metrics show cumulative count of Article Views (full-text article views including HTML views, PDF and ePub downloads, according to the available data) and Abstracts Views on Vision4Press platform.
Data correspond to usage on the plateform after 2015. The current usage metrics is available 48-96 hours after online publication and is updated daily on week days.
Initial download of the metrics may take a while.