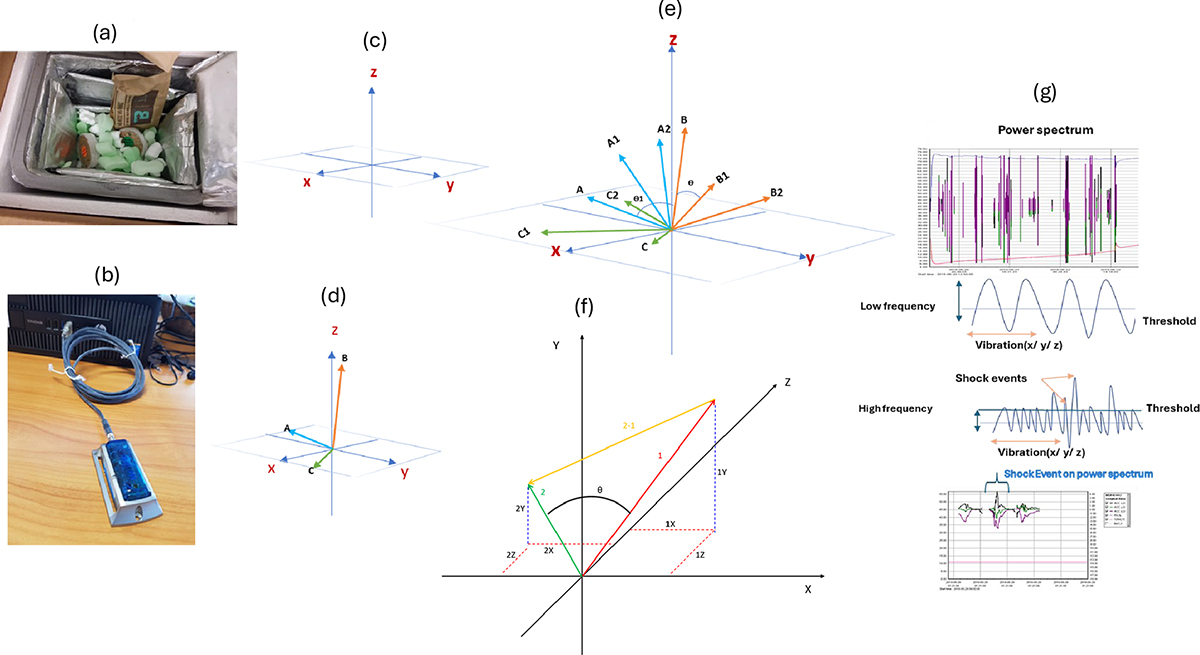
Figure S1.

Download original image
Diagrams and images of materials used for shock evaluation. (a) Image of the MSR 165 data logger used to measure vibration and shock during transportation, (b) Image showing packaging of pupae with S8 (chilled) and humidity packs before transportation of the 29-day-old group in the insulated box, (c) Output of the power spectrum as generated by the MSR 165 data logger software and illustrations of peaks of shock events at high and low frequency, (d, e, f) Illustration of the Cartesian plane showing the axis of movement (x, y, z) of the pupae and package during transportation following the right-hand rule. The length of vectors A, B and C denote the magnitude (scalar) of the vectors, while the angles determine the direction of the vector.
Current usage metrics show cumulative count of Article Views (full-text article views including HTML views, PDF and ePub downloads, according to the available data) and Abstracts Views on Vision4Press platform.
Data correspond to usage on the plateform after 2015. The current usage metrics is available 48-96 hours after online publication and is updated daily on week days.
Initial download of the metrics may take a while.


