Figure 4
Download original image
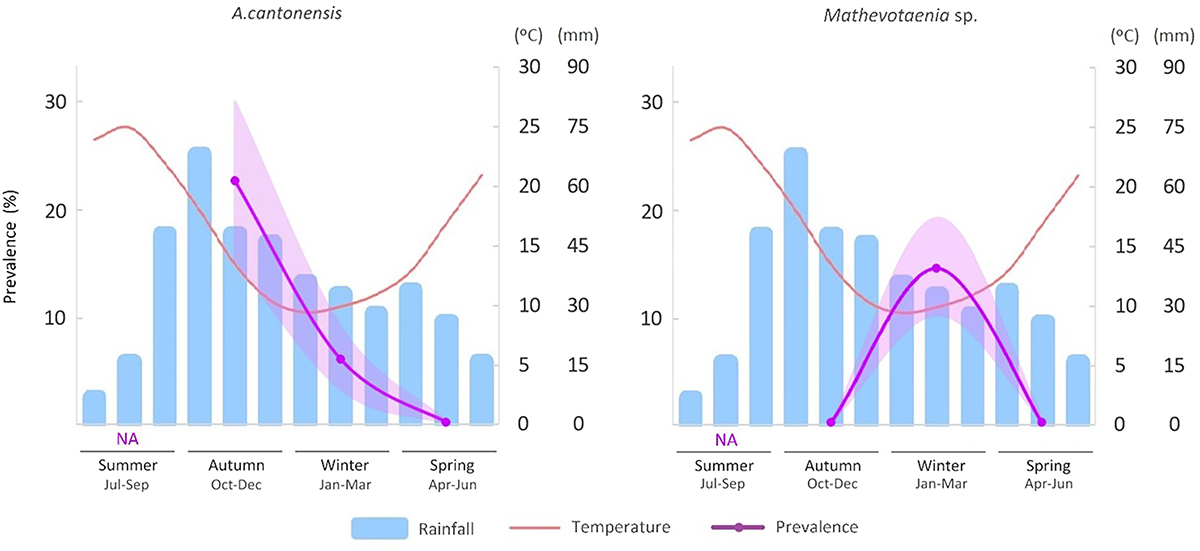
Seasonal prevalence (and standard error, represented as SE) of A. cantonensis and Mathevotaenia sp. in hedgehogs subjected to necropsies (purple lines). The figure also shows the mean monthly temperature (red line) and rainfall (blue bars) in Mallorca during the period 1971–2000 (data from Agencia Estatal de Meteorología AEMET).
Current usage metrics show cumulative count of Article Views (full-text article views including HTML views, PDF and ePub downloads, according to the available data) and Abstracts Views on Vision4Press platform.
Data correspond to usage on the plateform after 2015. The current usage metrics is available 48-96 hours after online publication and is updated daily on week days.
Initial download of the metrics may take a while.