Figure 5

Download original image
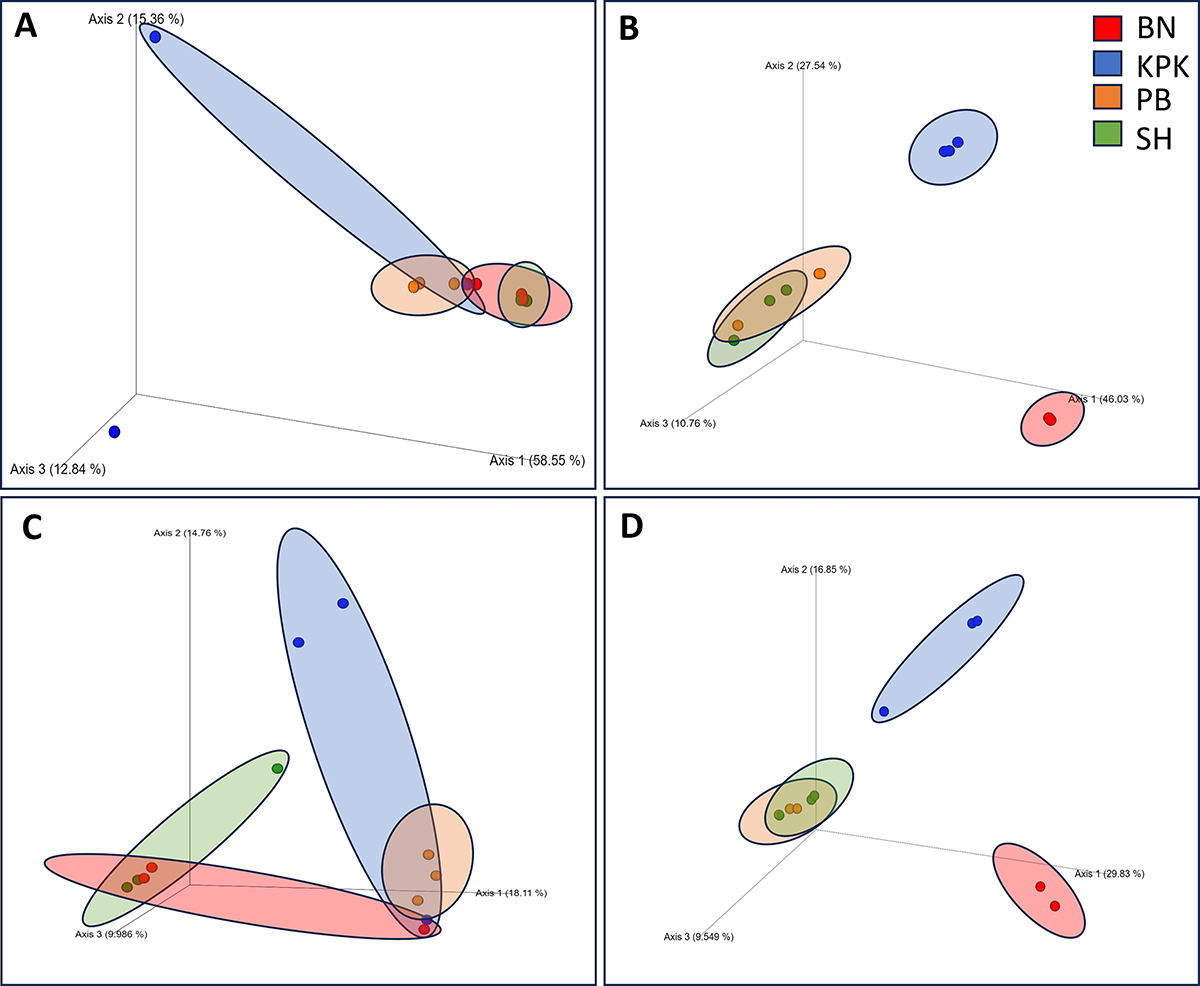
Principal coordinates analysis (PCoA) plots, A; Rhipicephalus microplus showed significant diversity on Bray–Curtis dissimilarity (p-value = 0.005) PERMANOVA test; otherwise most of the samples lie on the same axis and opposed dissimilarity. B; Hyalomma anatolicum Bray–Curtis clearly indicate that KPK and BN have higher dissimilarity as compared to PB and SH. C; Rhipicephalus microplus Jaccard distance indicates differences in microbial population based on presence and absence of ASVs. D; Hyalomma anatolicum Jaccard Distance clearly separated KPK and BN microbial populations.
Current usage metrics show cumulative count of Article Views (full-text article views including HTML views, PDF and ePub downloads, according to the available data) and Abstracts Views on Vision4Press platform.
Data correspond to usage on the plateform after 2015. The current usage metrics is available 48-96 hours after online publication and is updated daily on week days.
Initial download of the metrics may take a while.


