Figure 3
Download original image
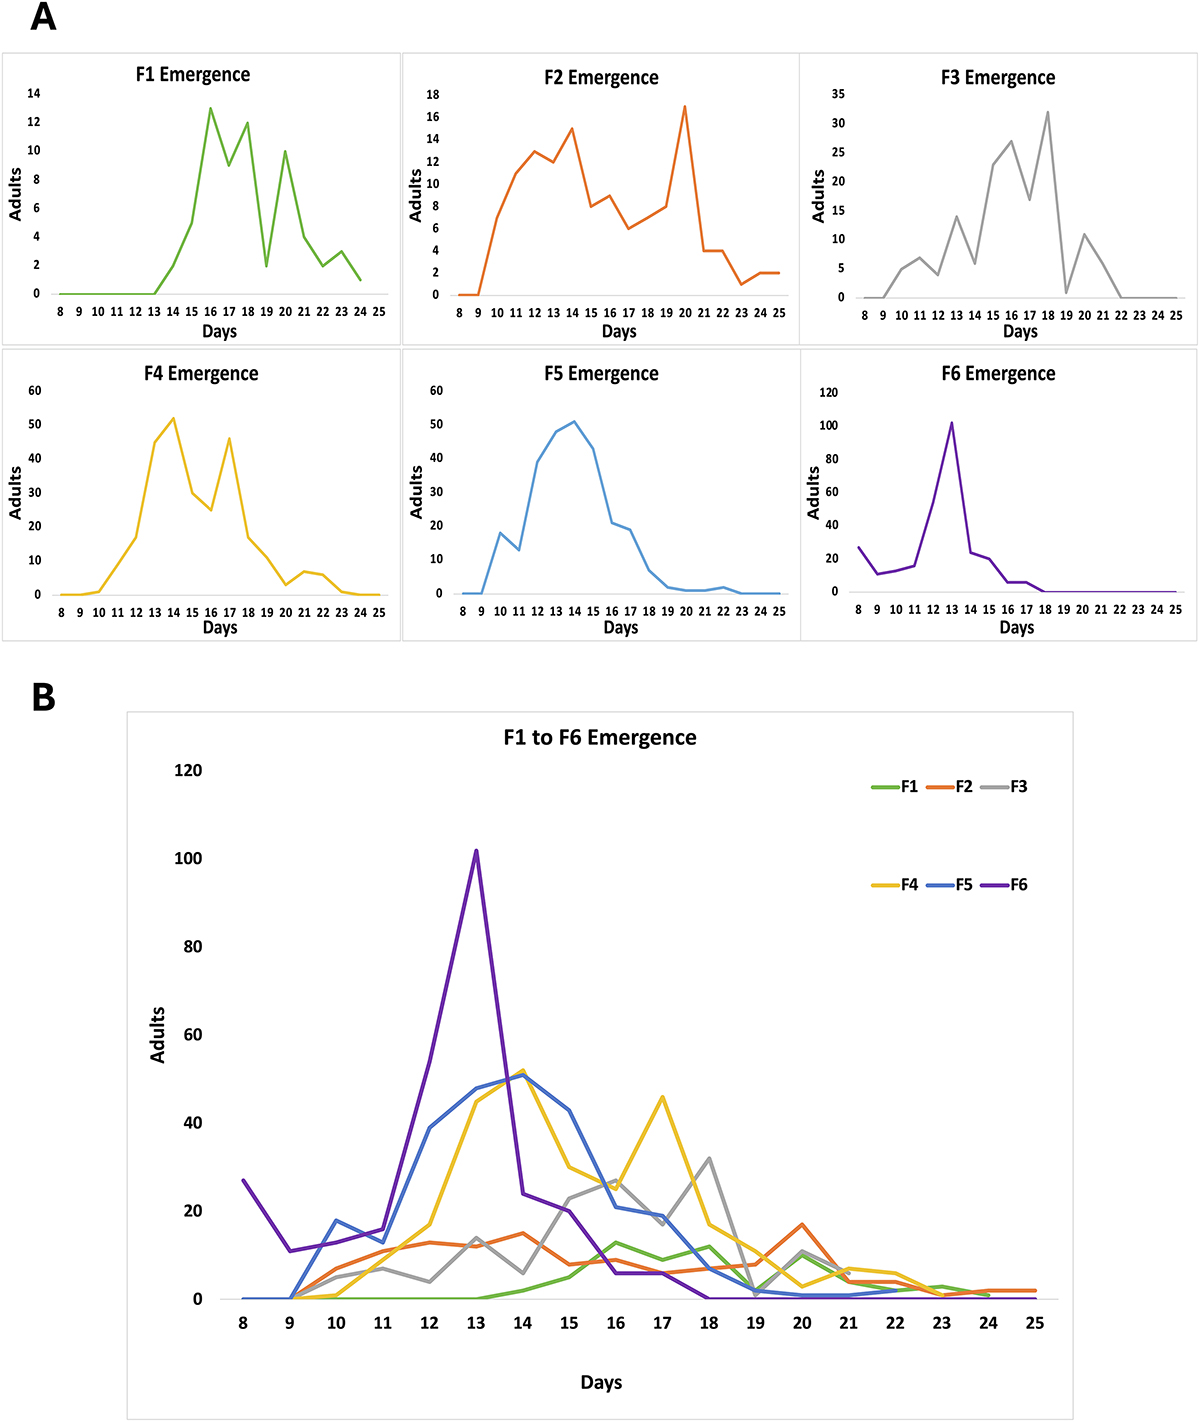
Graphic representation of An. coustani adult emergence at each generation. (A) Individual graphs showing the pattern of emergence of F1 to F6. (B) Aggregated graphs highlighting the clear changing patterns of adult emergence from F1 to F6 both in mode and date of the peak of emergence. The scale of the abscissa axis corresponds to days till the first appearance of L1.
Current usage metrics show cumulative count of Article Views (full-text article views including HTML views, PDF and ePub downloads, according to the available data) and Abstracts Views on Vision4Press platform.
Data correspond to usage on the plateform after 2015. The current usage metrics is available 48-96 hours after online publication and is updated daily on week days.
Initial download of the metrics may take a while.