Figure 1
Download original image
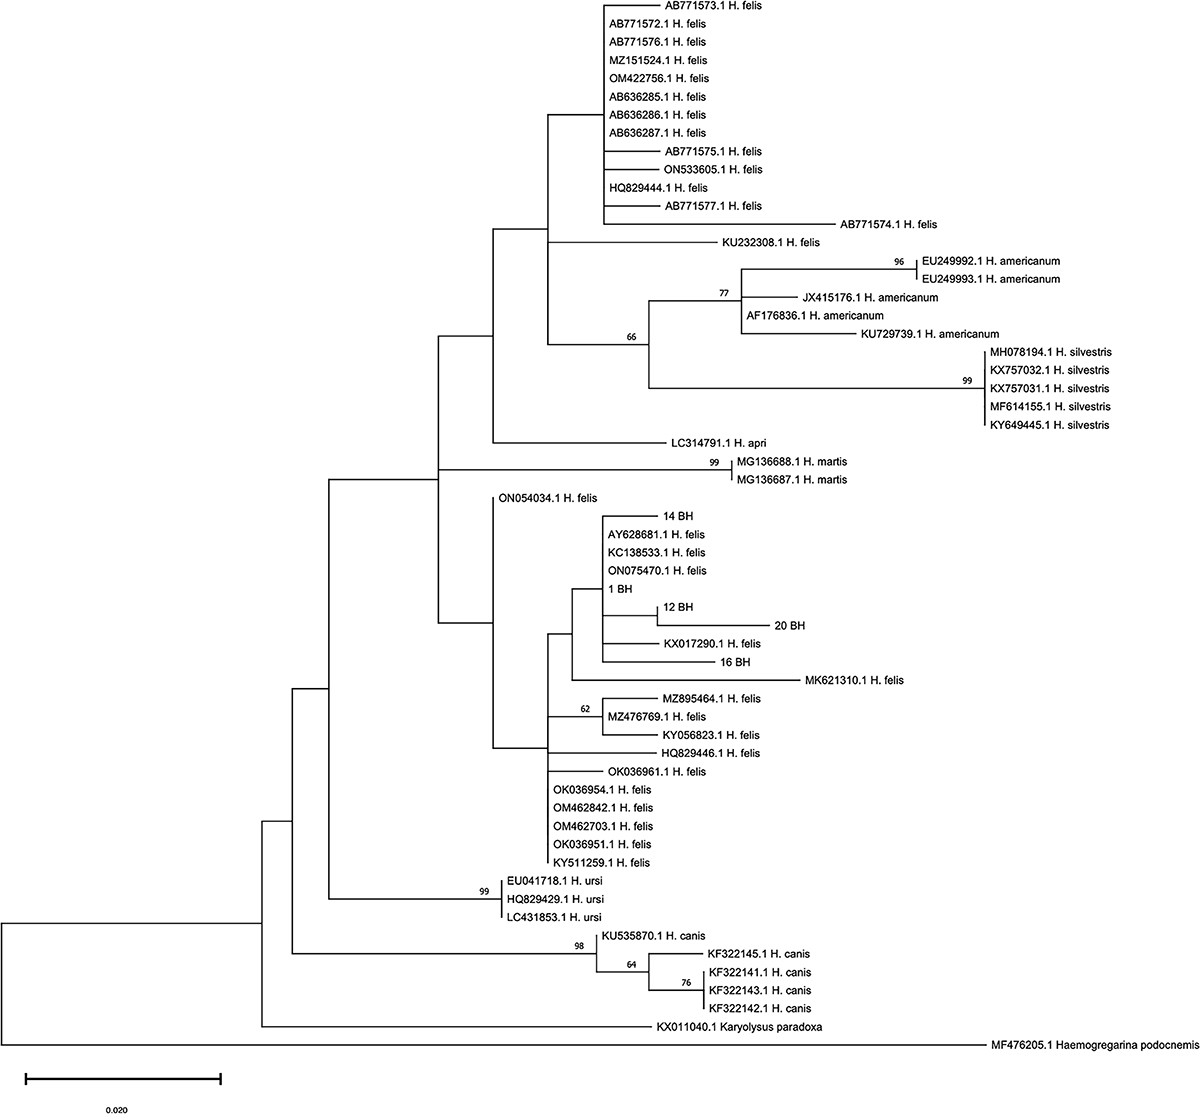
Phylogenetic tree showing relationships between isolates obtained in the present study and sequences used in the recent evolutionary analysis on Hepatozoon felis (Panda et al., 2024 [46]). The evolutionary history was inferred by using the Maximum Likelihood method and Hasegawa-Kishino-Yano model. The tree with the highest log likelihood (−783.89) is shown. The percentage of trees in which the associated taxa clustered together is shown above the branches. The tree is drawn to scale, with branch lengths measured in the number of substitutions per site. This analysis involved 58 nucleotide sequences, and there was a total of 184 positions in the final dataset.
Current usage metrics show cumulative count of Article Views (full-text article views including HTML views, PDF and ePub downloads, according to the available data) and Abstracts Views on Vision4Press platform.
Data correspond to usage on the plateform after 2015. The current usage metrics is available 48-96 hours after online publication and is updated daily on week days.
Initial download of the metrics may take a while.