Open Access
Figure 4
Download original image
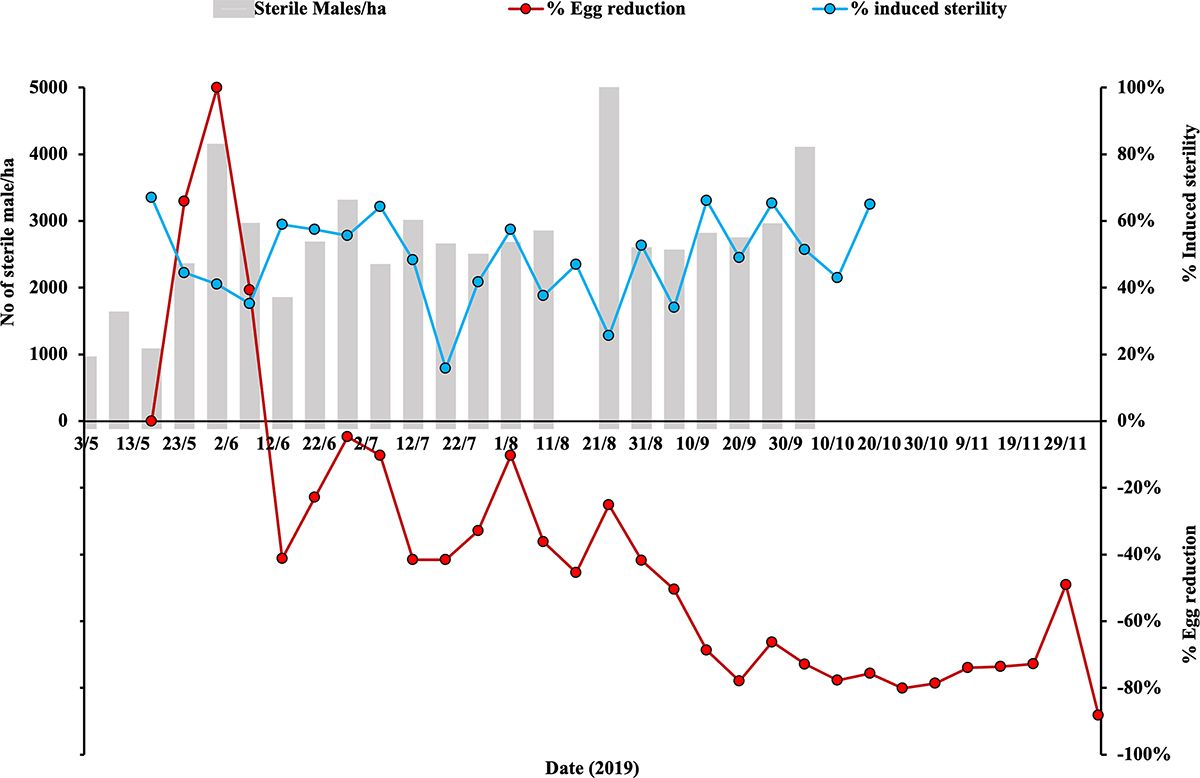
Seasonal patterns of induced sterility and egg reduction at the SIT plot as compared with the control area (right Y axis). The grey bars indicate the number of sterile males released per hectare (ha) per week from 03 May to 04 October (2019) at the SIT plot (left Y axis).
Current usage metrics show cumulative count of Article Views (full-text article views including HTML views, PDF and ePub downloads, according to the available data) and Abstracts Views on Vision4Press platform.
Data correspond to usage on the plateform after 2015. The current usage metrics is available 48-96 hours after online publication and is updated daily on week days.
Initial download of the metrics may take a while.