Figure 3
Download original image
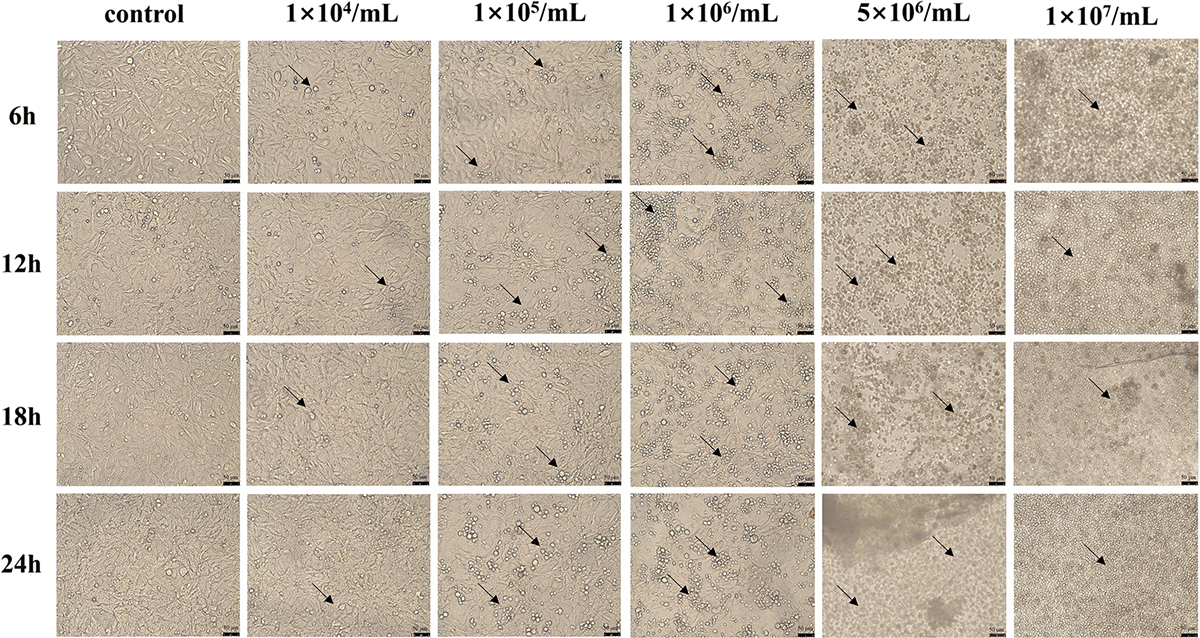
Morphological changes of IPEC-J2 cells after incubation with different concentrations of P. hominis. Microscopic images (200×) illustrating morphological alterations in IPEC-J2 cells co-incubated with varying concentrations (1 × 10⁴ cells/mL, 1 × 10⁵ cells/mL, 1 × 10⁶ cells/mL, 5 × 10⁶ cells/mL, 1 × 10⁷ cells/mL) of P. hominis (2.5 × 10⁵ IPEC-J2 cells) at different time points (6 h, 12 h, 18 h and 24 h). The black arrow marks the partially visible P. hominis parasites.
Current usage metrics show cumulative count of Article Views (full-text article views including HTML views, PDF and ePub downloads, according to the available data) and Abstracts Views on Vision4Press platform.
Data correspond to usage on the plateform after 2015. The current usage metrics is available 48-96 hours after online publication and is updated daily on week days.
Initial download of the metrics may take a while.