Figure 2

Download original image
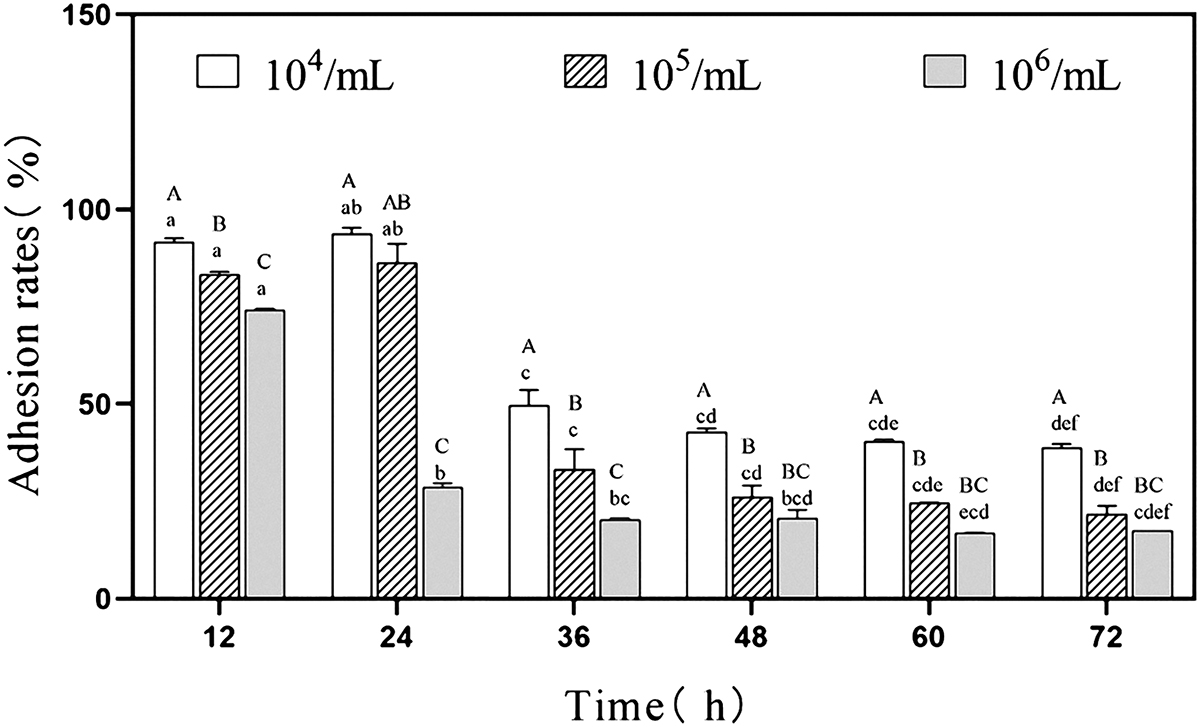
Adhesion rate of IPEC-J2 cells co-incubated with varying P. hominis concentrations. The adhesion rate is depicted as a bar graph, with the y-axis indicating the percentage of adhered cells, and the x-axis representing the incubation time in hours. Different colors and patterns represent the three initial inoculation amounts. To assess statistical significance, a one-way analysis of variance (ANOVA) was conducted. Letters A, B, and C indicate differences in initial inoculation amounts at the same time point, while lowercase letters a, b, c, d, e, and f denote differences in time points for the same initial inoculation amount. Similar letters indicate no significant difference.
Current usage metrics show cumulative count of Article Views (full-text article views including HTML views, PDF and ePub downloads, according to the available data) and Abstracts Views on Vision4Press platform.
Data correspond to usage on the plateform after 2015. The current usage metrics is available 48-96 hours after online publication and is updated daily on week days.
Initial download of the metrics may take a while.


