Figure 1
Download original image
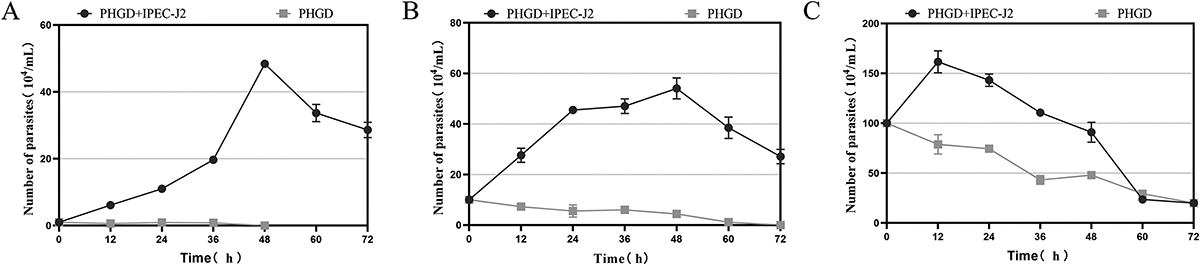
Growth curve of P. hominis co-incubated with IPEC-J2 cells. (A) depicts the growth curve with an initial inoculation concentration of 104 cells/mL of P. hominis, while (B) illustrates the response to an initial inoculation of 105 cells/mL of P. hominis. (C) shows the growth curve following an initial inoculation concentration of 106 cells/mL of P. hominis. The y-axis represents the parasite count, and the x-axis denotes the incubation time in hours. The gray squares represent the growth curve results for individual P. hominis, while the black spheres depict the growth curve results when co-incubated with IPEC-J2 cells.
Current usage metrics show cumulative count of Article Views (full-text article views including HTML views, PDF and ePub downloads, according to the available data) and Abstracts Views on Vision4Press platform.
Data correspond to usage on the plateform after 2015. The current usage metrics is available 48-96 hours after online publication and is updated daily on week days.
Initial download of the metrics may take a while.