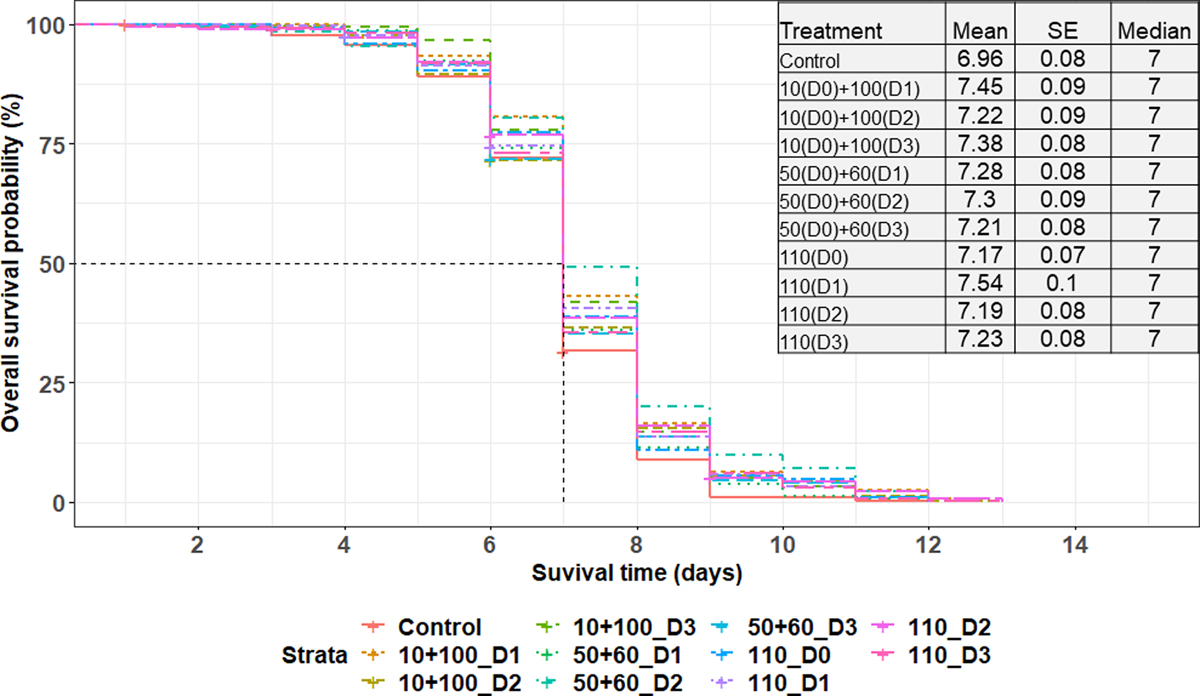
Figure 6

Download original image
Survival curves of male Glossina palpalis gambiensis irradiated as pupae with a single (110 Gy) or fractionated doses of 10 + 100 Gy and 50 + 60 Gy, separated by 1-, 2- and 3-day intervals (D1, D2, D3). The control group consisted of non-irradiated males. All flies were maintained under standard rearing conditions and were monitored under feeding stress. The black vertical line indicates the median survival time, representing the duration when the likelihood of survival decreased by 50%. The table accompanying the graphs displays the mean survival time, its standard error (SE), and the median.
Current usage metrics show cumulative count of Article Views (full-text article views including HTML views, PDF and ePub downloads, according to the available data) and Abstracts Views on Vision4Press platform.
Data correspond to usage on the plateform after 2015. The current usage metrics is available 48-96 hours after online publication and is updated daily on week days.
Initial download of the metrics may take a while.


