Open Access
Figure 6
Download original image
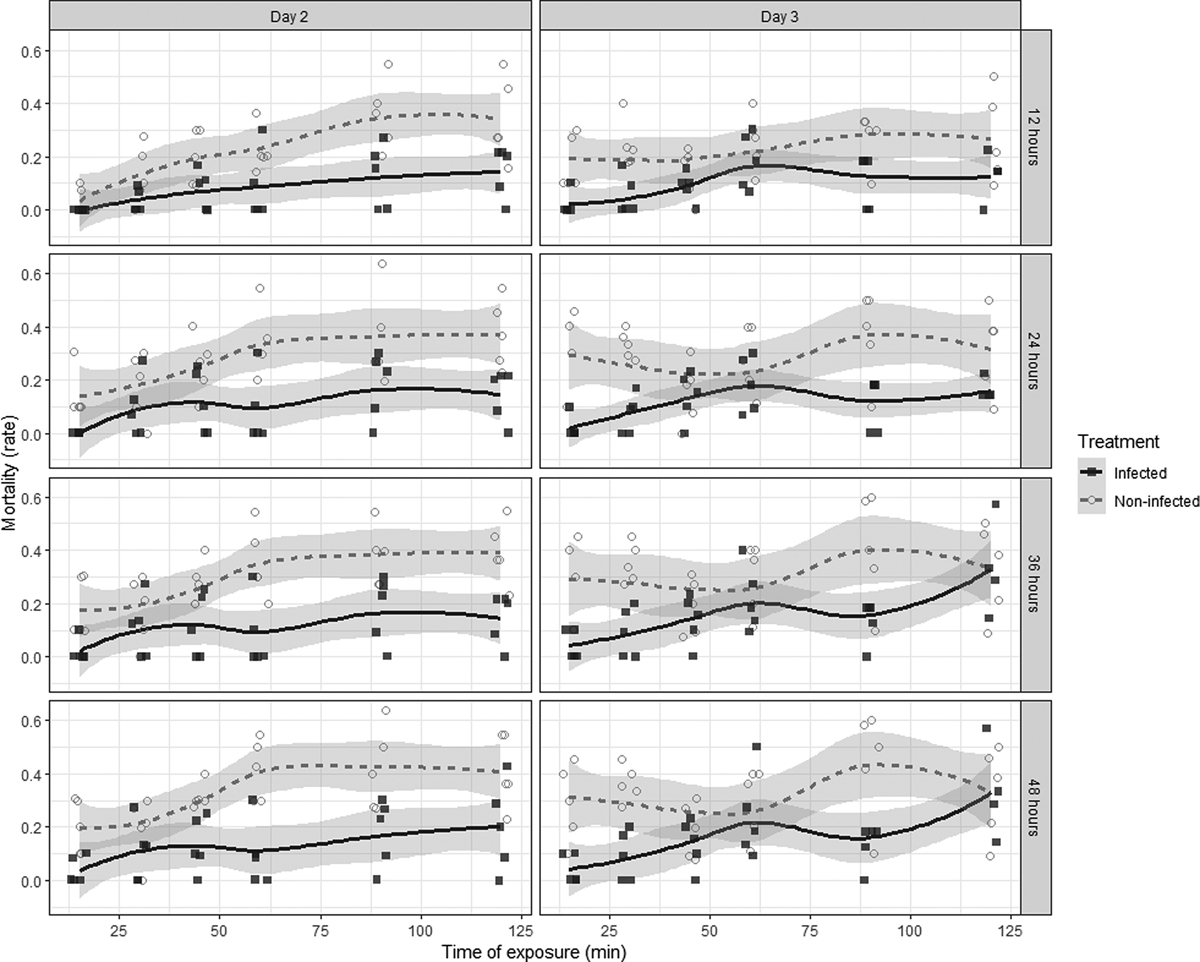
Mortality rate following acute cold shock according to the three predictors: cold exposure duration on x-axis (Time), Day of infection (panel Day 3 vs. Day 2) and Treatment (infected vs. control: clear vs. dark gray color). Confidence intervals of the fitted loess function (y ~ x) are shown (n = 5 × 10 flies).
Current usage metrics show cumulative count of Article Views (full-text article views including HTML views, PDF and ePub downloads, according to the available data) and Abstracts Views on Vision4Press platform.
Data correspond to usage on the plateform after 2015. The current usage metrics is available 48-96 hours after online publication and is updated daily on week days.
Initial download of the metrics may take a while.