Open Access
Figure 5
Download original image
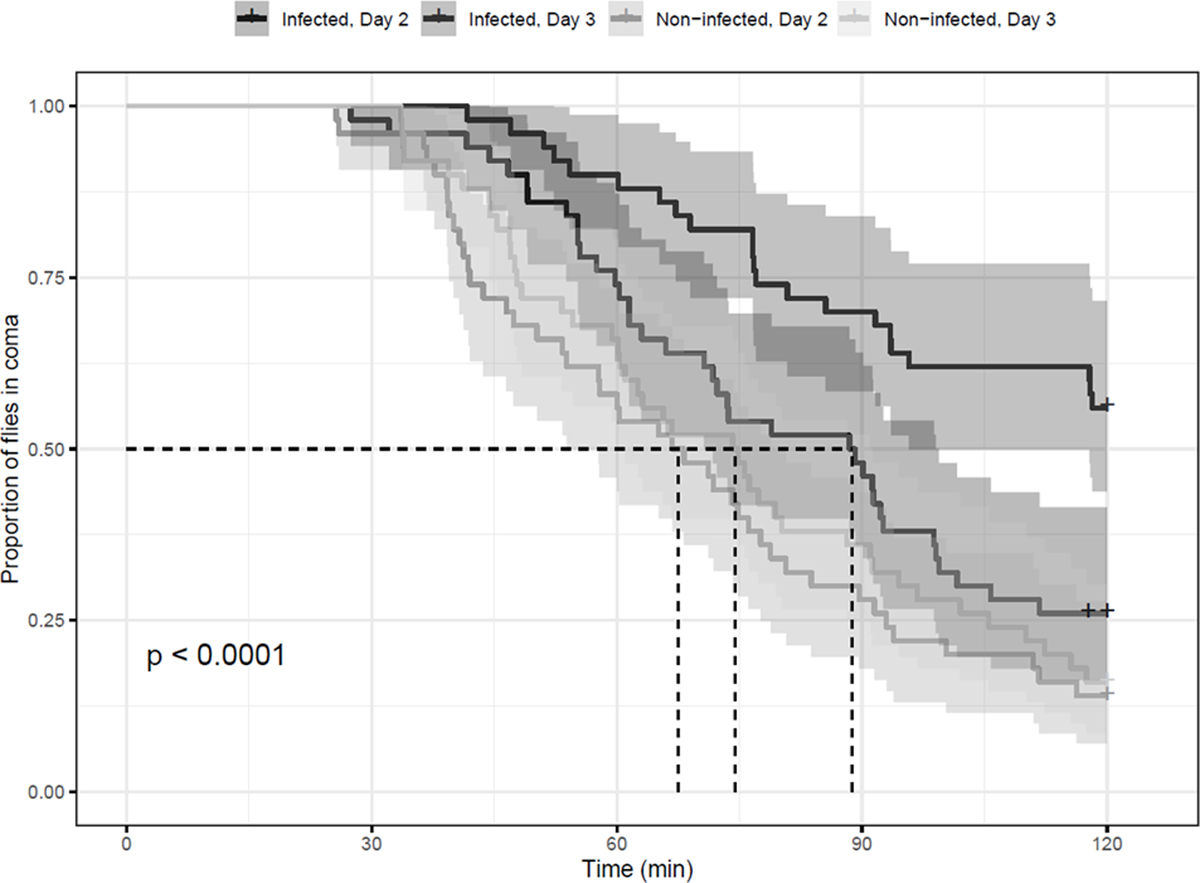
Proportion of flies in coma in relation to time for the different treatments indicated on top, with confidence intervals and p-values indicating the statistical significance of differences between the recovery curves. “Day” signifies the time following infection, while non/infected signifies the treatment (n = 50 flies).
Current usage metrics show cumulative count of Article Views (full-text article views including HTML views, PDF and ePub downloads, according to the available data) and Abstracts Views on Vision4Press platform.
Data correspond to usage on the plateform after 2015. The current usage metrics is available 48-96 hours after online publication and is updated daily on week days.
Initial download of the metrics may take a while.