Figure 3
Download original image
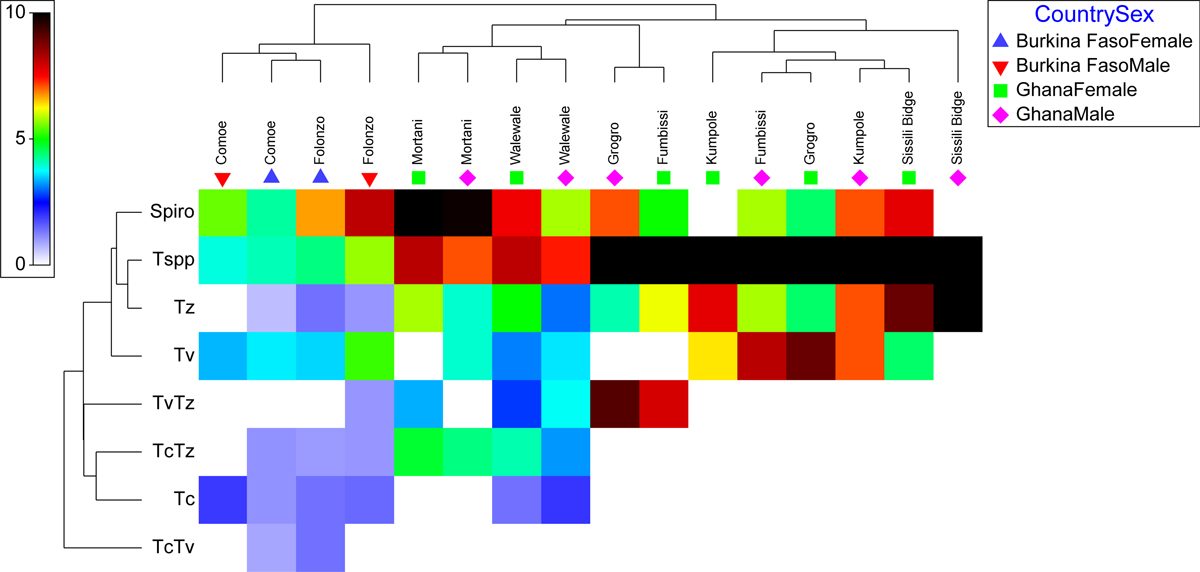
Prevalence of Spiroplasma and Trypanosoma (single and multiple) infections per country, location, and sex. Prevalence data were square root transformed and averaged based on location-sex and the matrix display was conducted in PRIMER version 7 + software. Tree on the left of the matrix is the similarity dendrogram based on the similarity index of the square root of the prevalence values. The color index is the square root of the prevalence values ranged 0–9 which is the square root of 0–81% prevalence.
Current usage metrics show cumulative count of Article Views (full-text article views including HTML views, PDF and ePub downloads, according to the available data) and Abstracts Views on Vision4Press platform.
Data correspond to usage on the plateform after 2015. The current usage metrics is available 48-96 hours after online publication and is updated daily on week days.
Initial download of the metrics may take a while.