Figure 4
Download original image
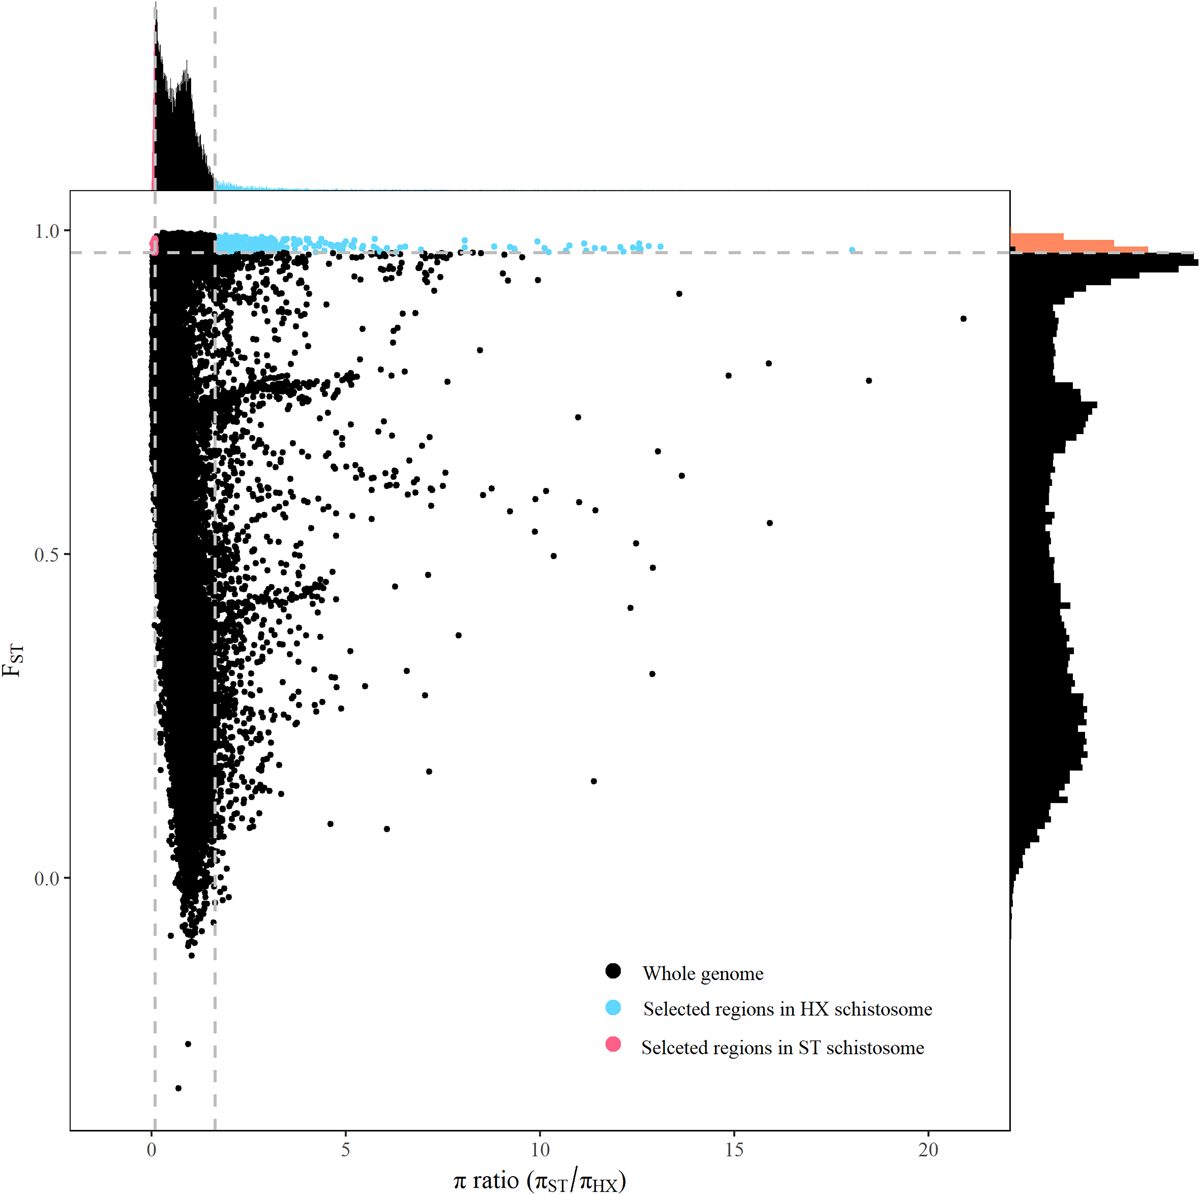
Distribution of π ratios (πST/πHX) and FST values calculated in 100-kb windows sliding in 10-kb steps throughout the genome. Data points colored red and blue were identified as selected regions in ST (red dots) and in HX (blue dots), respectively. These points correspond to the 5% left and right tails of the empirical π ratio distribution, where the π ratios are 0.092 and 1.643, respectively (vertical dashed lines), and the 5% right tail of the empirical FST distribution, where FST is 0.965 (horizontal dashed line).
Current usage metrics show cumulative count of Article Views (full-text article views including HTML views, PDF and ePub downloads, according to the available data) and Abstracts Views on Vision4Press platform.
Data correspond to usage on the plateform after 2015. The current usage metrics is available 48-96 hours after online publication and is updated daily on week days.
Initial download of the metrics may take a while.