Figure 2
Download original image
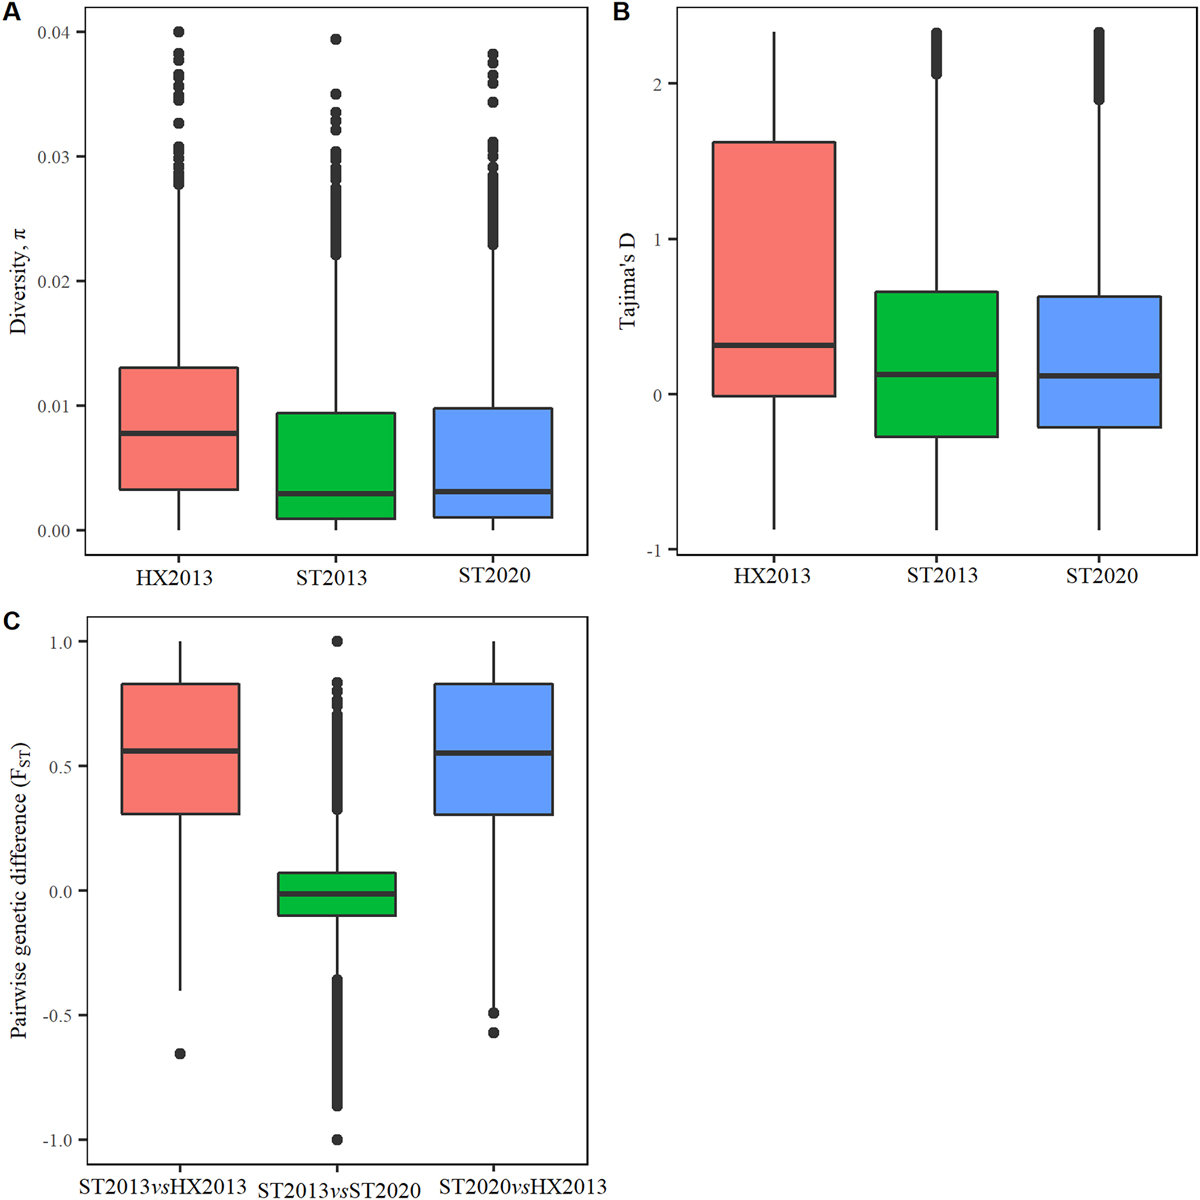
Box plots of diversity, Tajima’s D of S. japonicum and their FST. (A) Nucleotide diversity estimated in 100-kb windows sliding in 10-kb steps throughout the genome. (B) Tajima’s D estimated within a nonoverlapping 100-kb window throughout the genome. (C) pairwise FST computed in 100-kb windows sliding in 10-kb steps throughout the genome.
Current usage metrics show cumulative count of Article Views (full-text article views including HTML views, PDF and ePub downloads, according to the available data) and Abstracts Views on Vision4Press platform.
Data correspond to usage on the plateform after 2015. The current usage metrics is available 48-96 hours after online publication and is updated daily on week days.
Initial download of the metrics may take a while.