Figure 2
Download original image
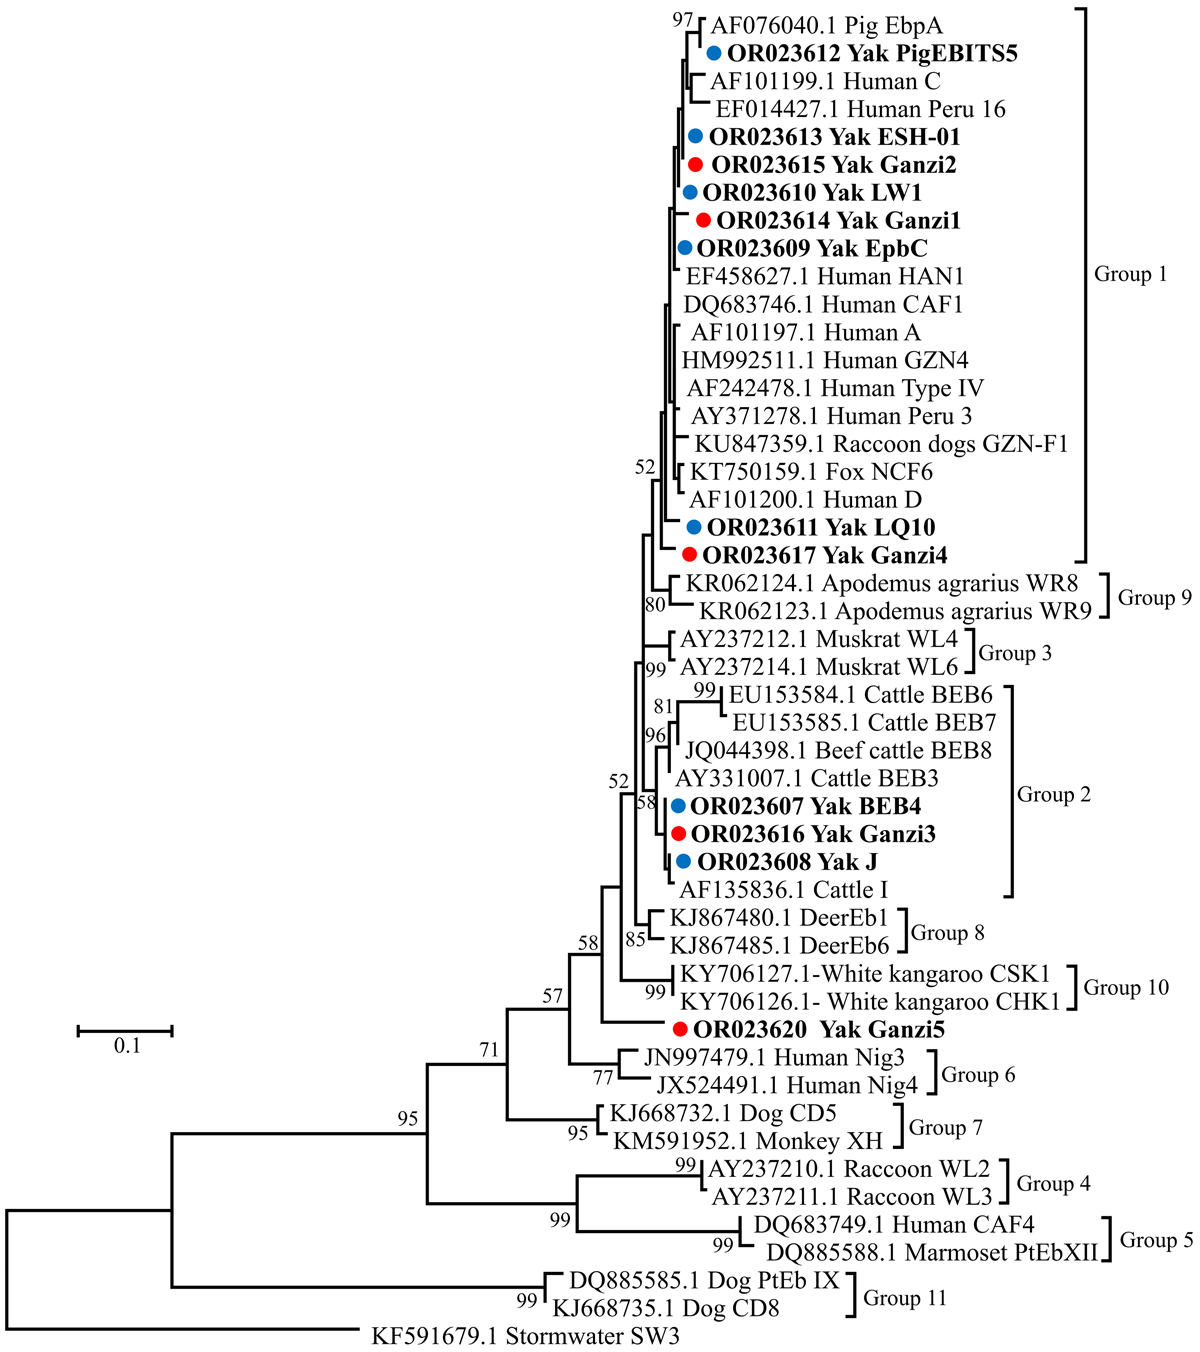
Phylogenetic relationships of E. bieneusi genotypes in this study, with reference sequences downloaded from GenBank based on the sequence analysis of the ITS locus using Maximum Likelihood analysis with the General Time Reversible model. Red and blue filled circles before the bold sample names represent novel and known genotypes identified in the present study, respectively. Bootstrap values (> 50) are indicated above the nodes. Scale bar indicates 0.1 nucleotide substitutions/site. Genotype SW3 from stormwater (KF591679.1) is used as the outgroup.
Current usage metrics show cumulative count of Article Views (full-text article views including HTML views, PDF and ePub downloads, according to the available data) and Abstracts Views on Vision4Press platform.
Data correspond to usage on the plateform after 2015. The current usage metrics is available 48-96 hours after online publication and is updated daily on week days.
Initial download of the metrics may take a while.