Figure 7
Download original image
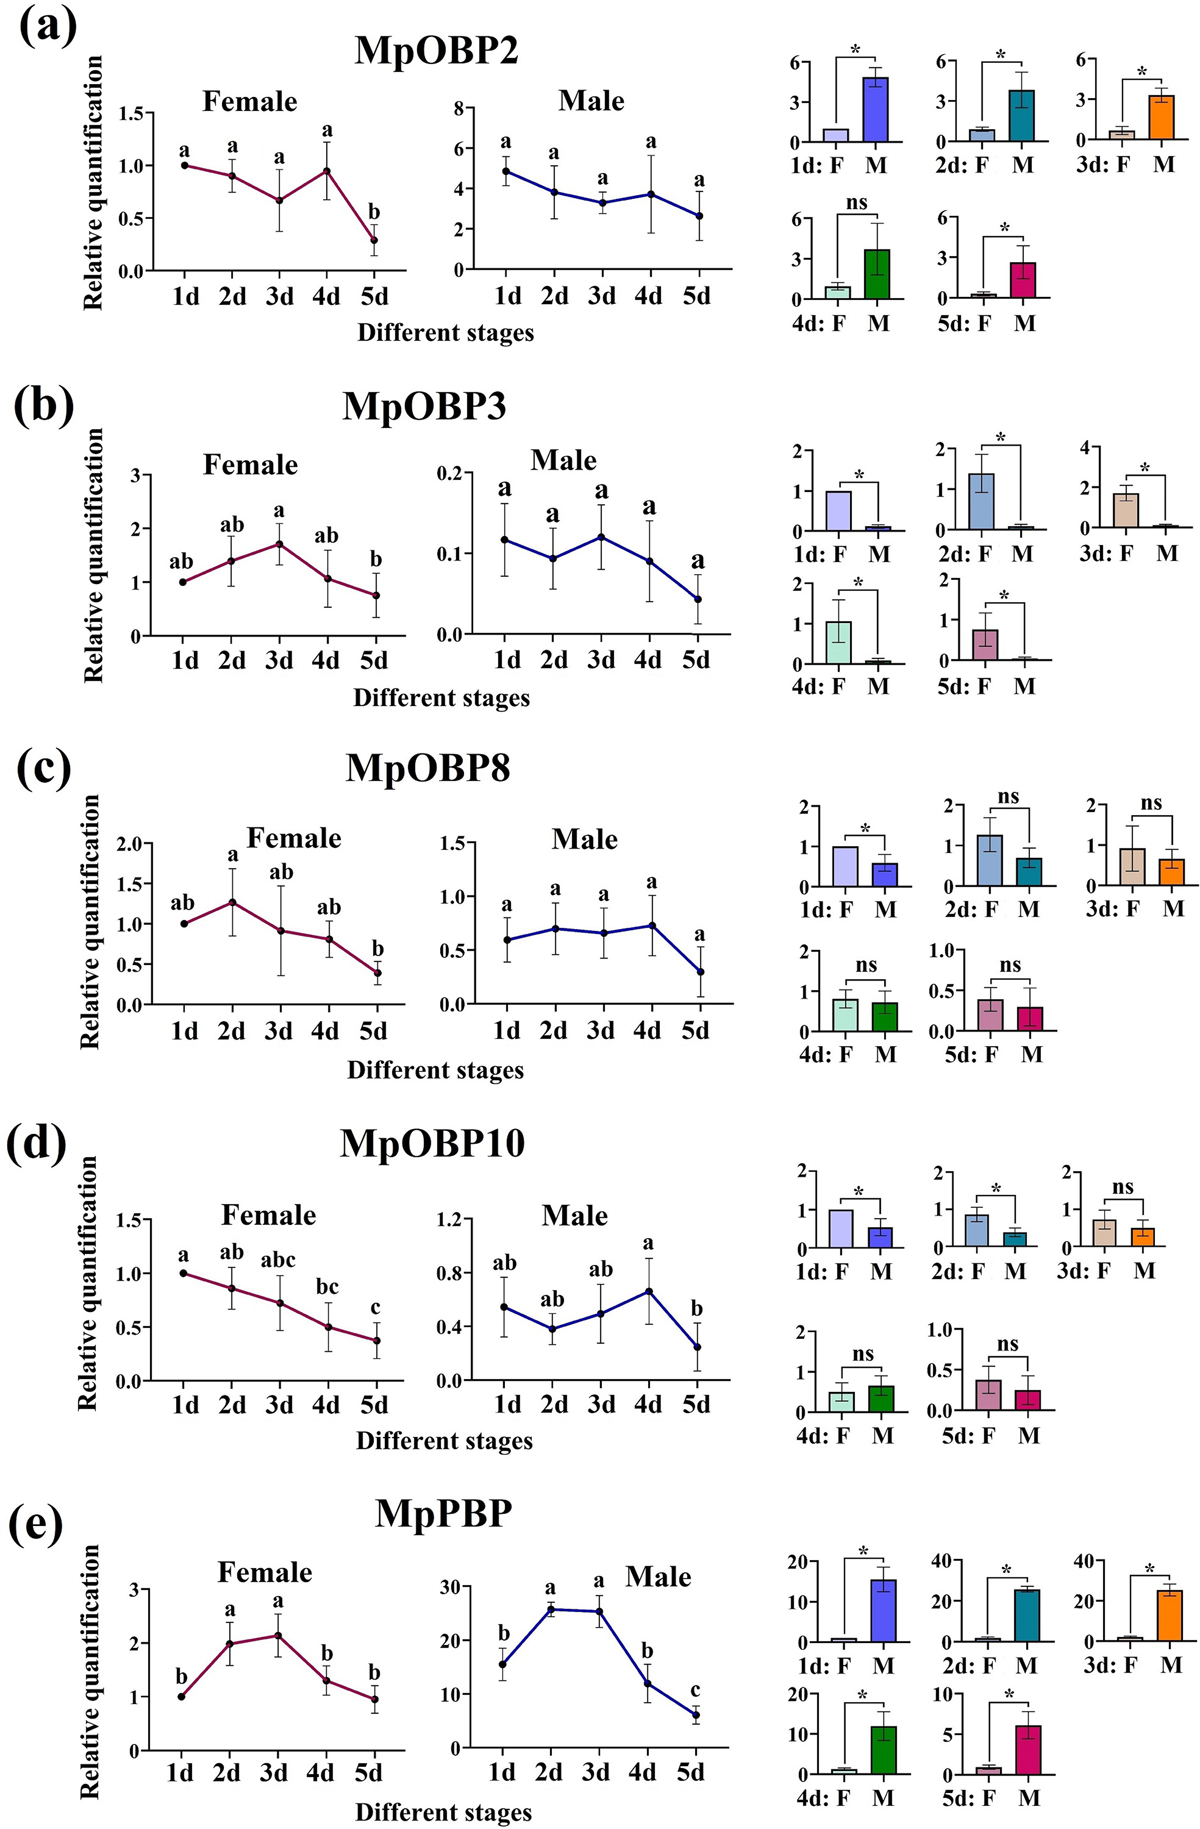
Relative quantification of M. pallidipes OBPs at different days after emergence to adulthood in female and male wasps. (a–e) MpOBP2, MpOBP3, MpOBP8, MpOBP10, and MpPBP, respectively. The two charts on the left represent comparisons of OBP expression at different days after emergence to adulthood, and the five small charts on the right represent comparisons of female and male OBP expression. Day or sex is on the x-axis and relative quantification of M. pallidipes OBPs is on the y-axis. Bars represent standard deviations. 1d–5d: 1-day-old adults, 2-day-old adults, 3-day-old adults, 4-day-old adults, and 5-day-old adults; F: female, M: male. Different lower-case letters indicate a significant difference (one-way ANOVA, p < 0.05). ns means no significant difference and * means a significant difference (t-test, p < 0.05).
Current usage metrics show cumulative count of Article Views (full-text article views including HTML views, PDF and ePub downloads, according to the available data) and Abstracts Views on Vision4Press platform.
Data correspond to usage on the plateform after 2015. The current usage metrics is available 48-96 hours after online publication and is updated daily on week days.
Initial download of the metrics may take a while.