Figure 5
Download original image
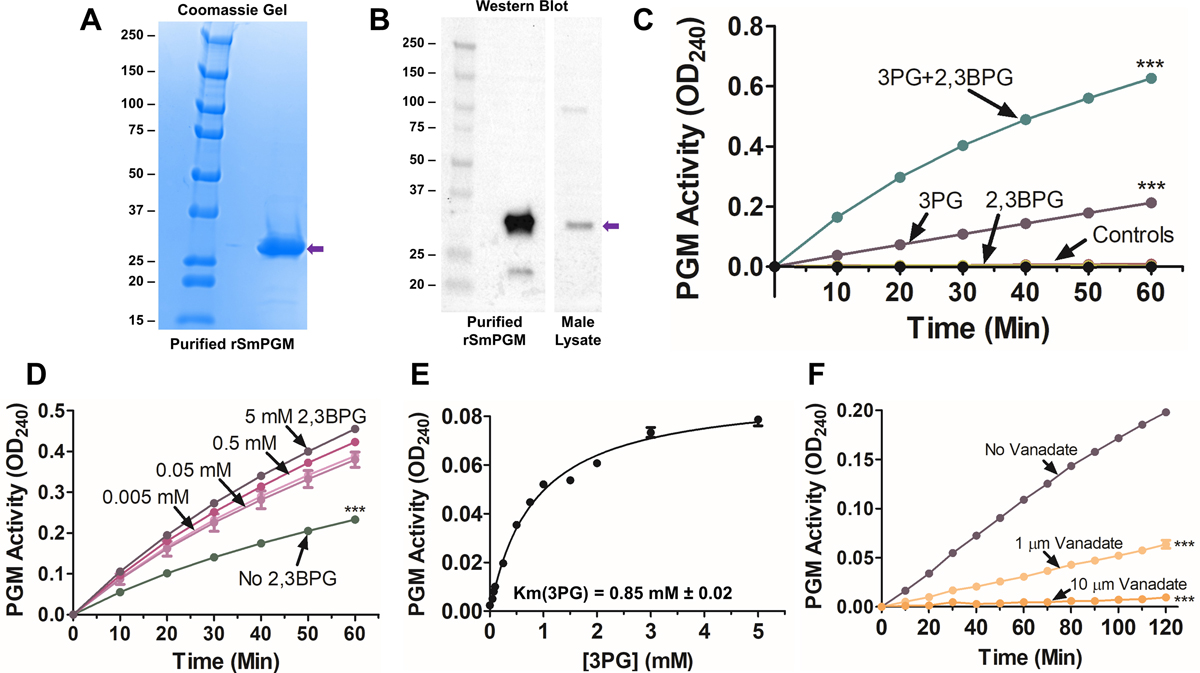
Expression, purification, and characterization of rSmPGM. (A) Coomassie Blue-stained gel showing purified rSmPGM running at ~28 kDa (purple arrow). Molecular mass markers are shown (left); numbers represent kDa. (B) Western blot showing pure rSmPGM (left) detection using a commercial anti-PGM antibody. A prominent protein band running at the expected size of SmPGM is detected in adult S. mansoni male lysate (right, purple arrow). Numbers to the left of the Coomassie and western blots indicate molecular markers representing molecular mass in kDa. (C) rSmPGM activity in the presence of either substrate 3PG only (purple line) or 3PG plus cofactor 2,3BPG (teal line, top). One notable control includes reaction in the presence of 2,3BPG only. Other controls include samples lacking 3PG, enolase, or rSmPGM. ***p < 0.001 (two-way ANOVA with Bonferroni post-test). (D) rSmPGM activity in the absence of 2,3BPG (3PG Only, green line) or supplemented with 0.005–5.0 mM 2,3BPG (pink and purple lines). ***p < 0.001 (two-way ANOVA with Bonferroni post-test). (E) Michaelis-Menten kinetic curve shown for the substrate 3PG. The Km value shown is the mean from three independent experiments. (F) Inhibition of rSmPGM activity by 1 μM (light orange line) or 10 μM (dark orange line) sodium metavanadate. Samples with no inhibitor (purple line) served as a control. ***p < 0.001 (two-way ANOVA with Bonferroni post-test at 120 min).
Current usage metrics show cumulative count of Article Views (full-text article views including HTML views, PDF and ePub downloads, according to the available data) and Abstracts Views on Vision4Press platform.
Data correspond to usage on the plateform after 2015. The current usage metrics is available 48-96 hours after online publication and is updated daily on week days.
Initial download of the metrics may take a while.