Figure 3
Download original image
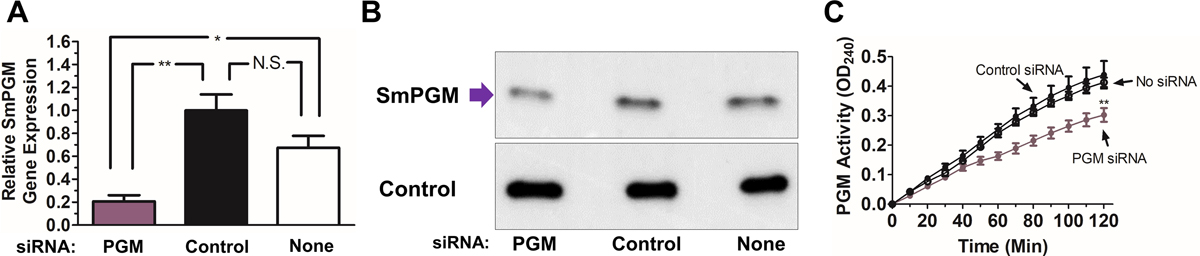
SmPGM gene suppression using RNA interference. (A) Relative SmPGM gene expression in schistosomula 72 h after electroporation with siRNA targeting SmPGM (purple bar, PGM), control siRNA (black bar, Control) or no siRNA (white bar, None) as assessed by RT-qPCR. Significant differences are denoted by *p < 0.05, **p < 0.01 (one-way ANOVA with Tukey’s post-test). (B) Western blot analysis of SmPGM protein (purple arrow) in schistosomula lysates 7 days after electroporation with siRNA targeting SmPGM (left), control siRNA (middle), or no siRNA (right) as indicated. Blots were probed with anti-GAPDH monoclonal antibody (lower panel, Control) to show that all lanes received roughly equivalent amounts of protein. (C) Mean SmPGM activity in live schistosomula tested 7 days after electroporation with siRNA targeting SmPGM (purple line), control siRNA (black line, filled circles), or no siRNA (black line, empty circles). Significant differences for all time points after 70 min are denoted by **p < 0.01 (two-way ANOVA with Bonferroni post-test).
Current usage metrics show cumulative count of Article Views (full-text article views including HTML views, PDF and ePub downloads, according to the available data) and Abstracts Views on Vision4Press platform.
Data correspond to usage on the plateform after 2015. The current usage metrics is available 48-96 hours after online publication and is updated daily on week days.
Initial download of the metrics may take a while.