Figure 2
Download original image
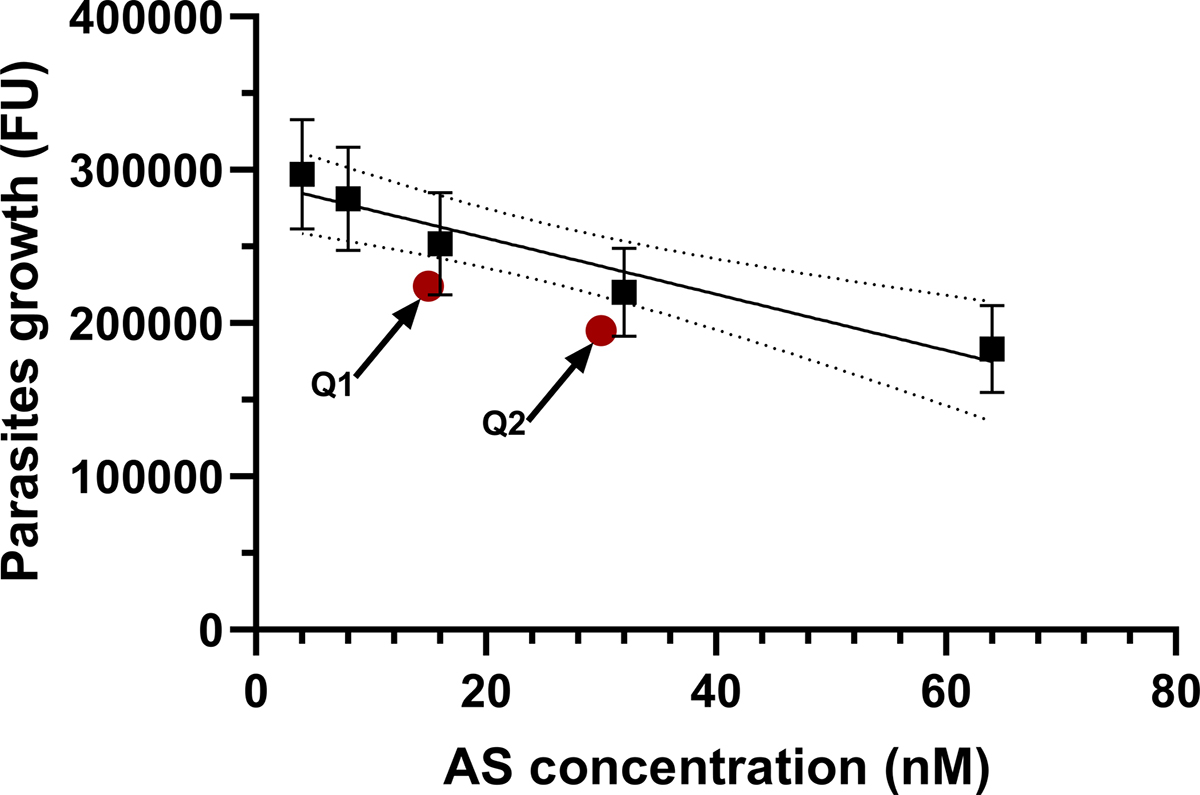
Standard curve of the quantitative test with the 95% confidence interval for artesunate controls samples. The equation of the curve (■) was y = −1831x + 292150 (r2 = 0.9373). The antimalarial activities of the controls (![]() ), plotted against their respective expected concentrations (Q1 = 15 nM and Q2 = 30 nM), fell outside the 95% confidence interval of the curve. Data are presented as mean ± SD (n ≥ 6). FU = fluorescence unit; AS = artesunate; nM = nanomolar.
), plotted against their respective expected concentrations (Q1 = 15 nM and Q2 = 30 nM), fell outside the 95% confidence interval of the curve. Data are presented as mean ± SD (n ≥ 6). FU = fluorescence unit; AS = artesunate; nM = nanomolar.
Current usage metrics show cumulative count of Article Views (full-text article views including HTML views, PDF and ePub downloads, according to the available data) and Abstracts Views on Vision4Press platform.
Data correspond to usage on the plateform after 2015. The current usage metrics is available 48-96 hours after online publication and is updated daily on week days.
Initial download of the metrics may take a while.